
Gold bugs will be beside themselves as the precious metal pops above $3,400 an ounce, takes its one-year gain to 46% (in dollar terms) and tries to set another all-time high, in response to ongoing worries about inflation, Government debt and now fresh tensions in the Middle East.
Gold is soaring again
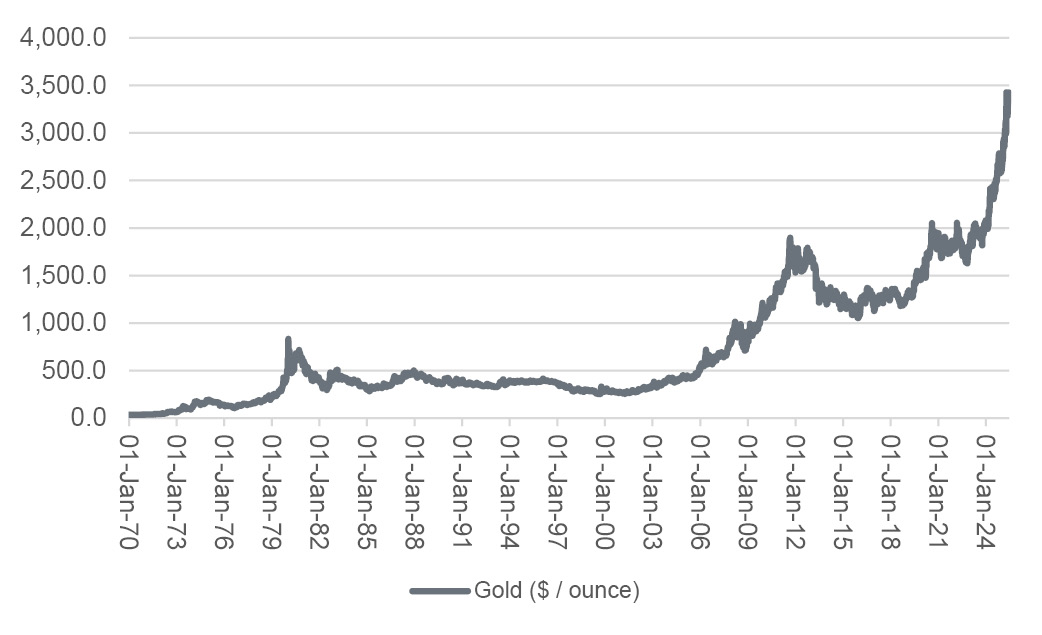
Source: LSEG Refinitiv data
“Having spent years shouting about gold and its protective qualities, holders of the metal may soon have a different decision to take if it keeps going. The more people who buy in, the more of a consensus position it becomes, and the more of a consensus position it becomes, the fewer incremental buyers there are to drive up the price.”
Having spent years shouting about gold and its protective qualities, holders of the metal may soon have a different decision to take if it keeps going. The more people who buy in, the more of a consensus position it becomes, and the more of a consensus position it becomes, the fewer incremental buyers there are to drive up the price.
True believers in gold will continue to warn of the dangers of debt, inflation and geopolitics. Others may at least think about a portfolio rebalancing to ensure they do not become over-exposed.
The trick is assessing fair value.
The all-in-sustained cost (AISC) of production can perhaps help to gauge what the downside may be. This is around $1,400 to $1,500 an ounce for major producers such as New York-listed Newmont or Barrick Mining. But that does not help advisers or clients to judge any possible upside. Moreover, gold is inert, so there are no earnings, and it generates no cash, so there is no yield.
Those issues support Warren Buffett’s view that the precious metal has no role in portfolios, but gold has been money since time immemorial, and the latest rounds of central bank stockpiling imply this latter view still holds currency at the highest level. So where to begin?
One crude way to do it may be to measure how much gold a pay packet can buy. If the metal moves beyond the reach of the worker, that could at least crimp jewellery demand and one source of incremental buying. Consistent wage data with real longevity is hard to find, but the US Federal Reserve offers nearly sixty years of figures for “production and non-supervisory employees.” In translation this sounds like factory floor jobs, for want of better turns of phrase, so it should do nicely.
“Before US President Nixon took America off the Gold Standard and smashed up the Bretton Woods monetary system in August 1971, it took a blue-collar American worker 12 hours to earn enough to buy an ounce of gold. That figure peaked at 97 hours in late 1980 and 94 hours in 2011.”
Before US President Nixon took America off the Gold Standard and smashed up the Bretton Woods monetary system in August 1971, it took a blue-collar American worker 12 hours to earn enough to buy an ounce of gold. That figure peaked at 97 hours in late 1980 and 94 hours in 2011. In this context, the current score of 105 hours could be seen as ominous for gold affordability, since the best cure for high prices is high prices – they stoke supply, depress demand, prompt searches for substitutes or all three.
Gold is soaring again
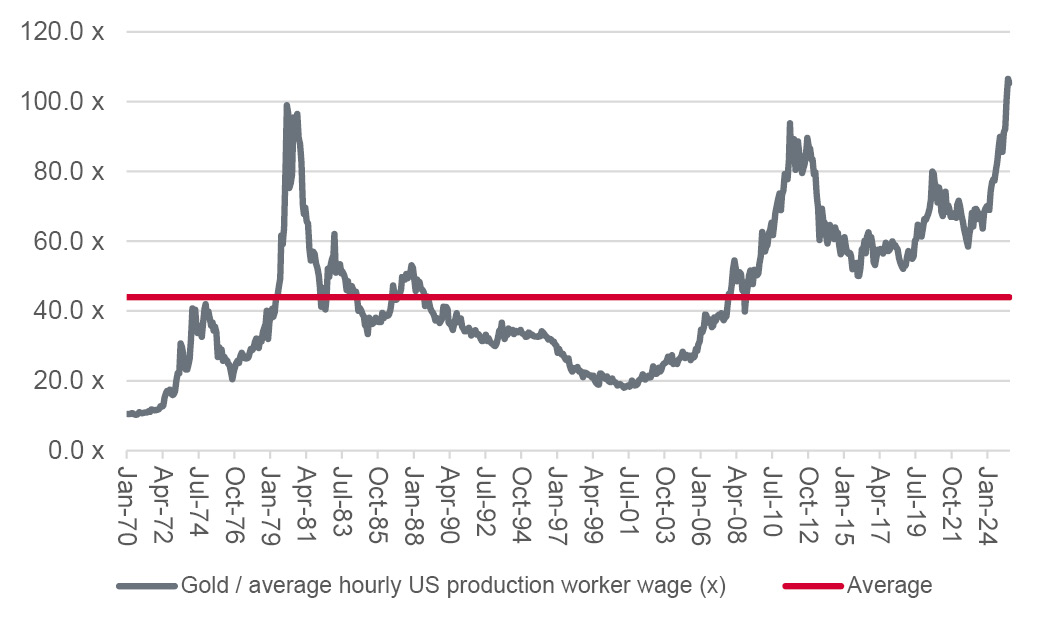
Source:LSEG Refinitiv data, FRED – St. Louis Federal Reserve database
Gold bugs will counter by saying that inflation (and central bank money printing to cover monstrous Government debts) can drag wages along for the ride, so they may not budge, especially as the metal’s gains still pale compared to those of the inflation-wracked 1970s, when uncertainty in the Middle East was also a key global issue.
“Gold miners have lagged gold and that may be an option, as they should start to generate plentiful profits and copious cash flow, if gold prices stay elevated and they suffer no meteorological, geological, political or regulatory mishaps (admittedly, that is a big ‘if’ in some cases and some jurisdictions, as Barrick Mining will attest).”
Gold miners have lagged gold and that may be an option, as they should start to generate plentiful profits and copious cash flow, if gold prices stay elevated and they suffer no meteorological, geological, political or regulatory mishaps (admittedly, that is a big ‘if’ in some cases and some jurisdictions, as Barrick Mining will attest).
Equally, it may be no coincidence that other commodity prices are starting to motor, particularly in the case of those that look cheap relative to gold.
Oil looks cheap relative to gold...
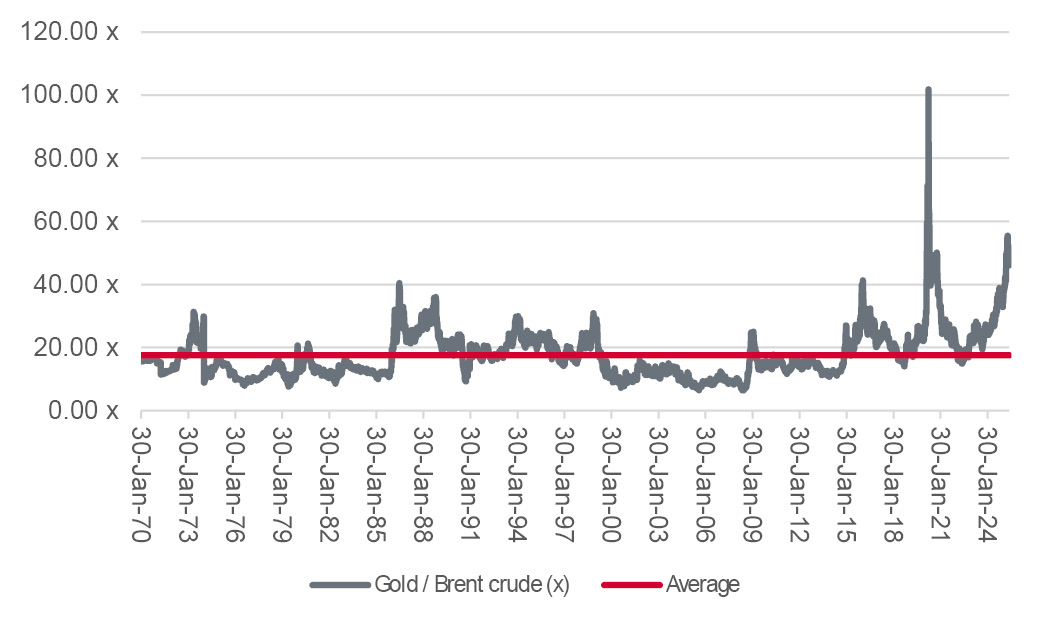
Source: LSEG Refinitiv data
...as does platinum...
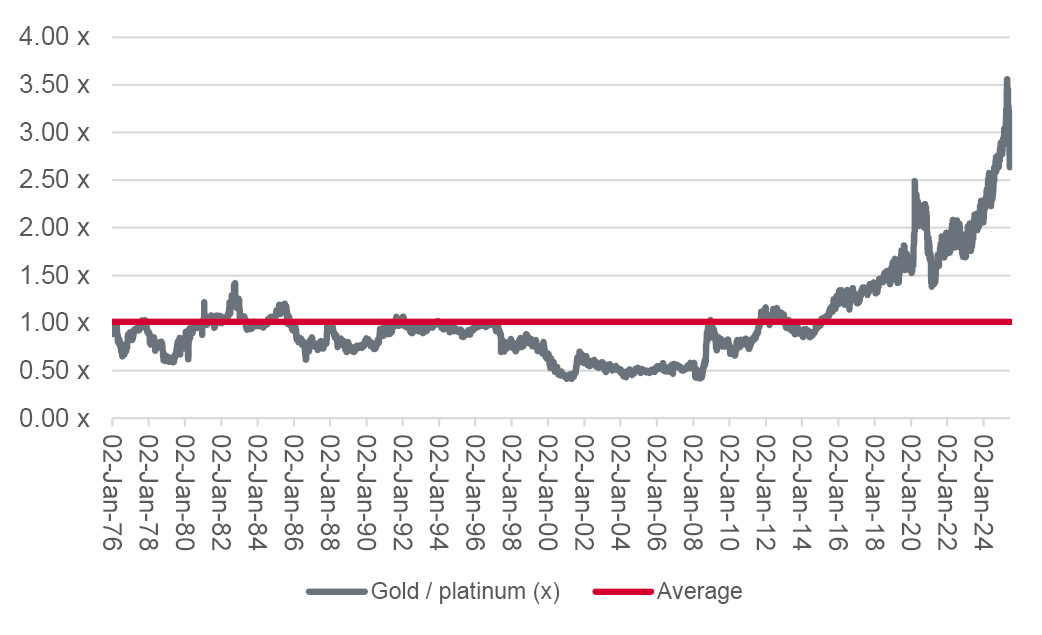
Source: LSEG Refinitiv data
...as does silver...
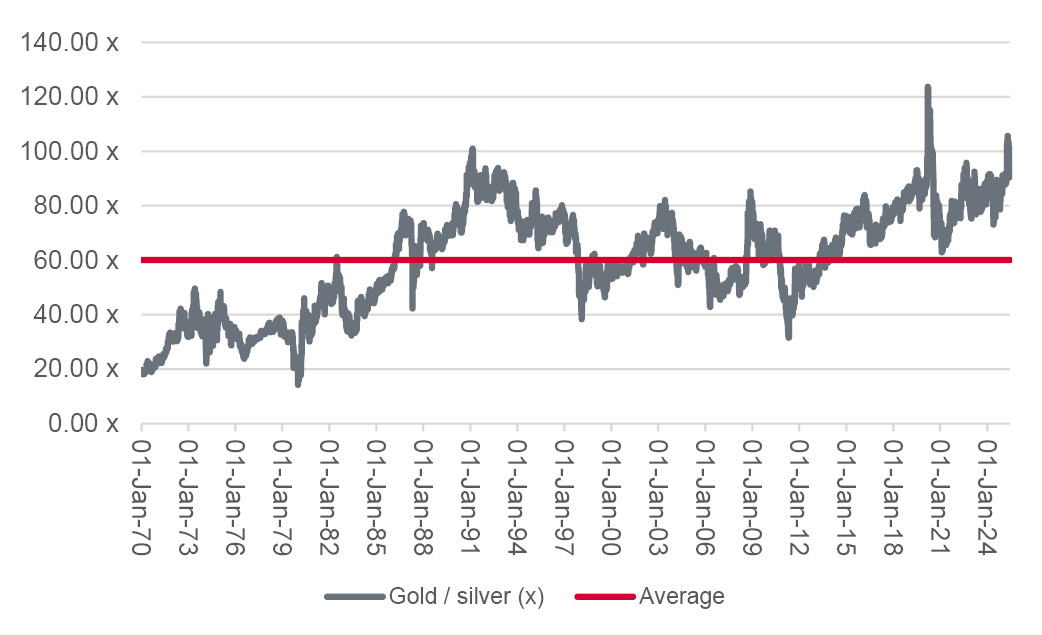
Source: LSEG Refinitiv data
and perhaps copper, too...
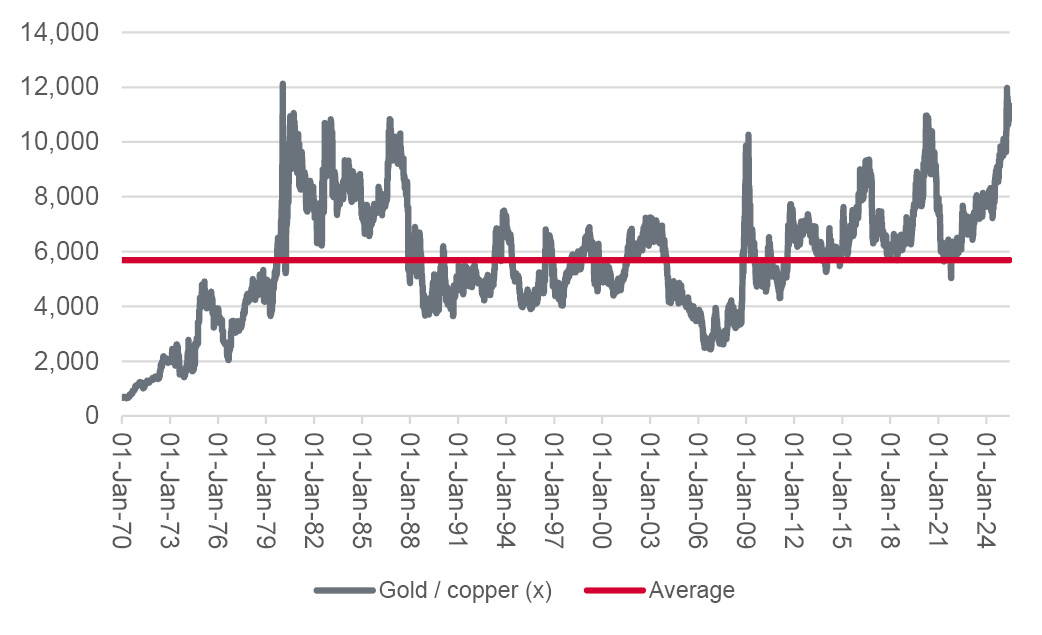
Source: LSEG Refinitiv data
These historic, price-relative trading ranges offer no guarantees for the future at all. Those advisers and clients who fear inflation may like to maintain a bias to raw materials, relative to ‘paper’ ones like cash and bonds, but diversify their exposure to ‘real’ assets beyond gold. Those advisers and clients who fear a slowdown, recession or even debt deflation may take the entirely opposite view.
“But at least portfolio builders can judge current market thinking by using the gold-to-copper relationship in particular. The stronger gold is relative to copper, the greater the worries about inflation and central bank loss of control. The stronger copper is relative to gold, the more upbeat markets may feel on the economy and corporate earnings.”
But at least portfolio builders can judge current market thinking by using the gold-to-copper relationship in particular. The stronger gold is relative to copper, the greater the worries about inflation and central bank loss of control. The stronger copper is relative to gold, the more upbeat markets may feel on the economy and corporate earnings.
Past performance is not a guide to future performance and some investments need to be held for the long term.


This area of the website is intended for financial advisers and other financial professionals only. If you are a customer of AJ Bell Investcentre, please click ‘Go to the customer area’ below.
We will remember your preference, so you should only be asked to select the appropriate website once per device.
