

The US second-quarter earnings season is about to reach full throttle. According to research from S&P Global’s Howard Silverblatt, 31 members of the S&P 500 index have already reported earnings. Of those, 22 beat earnings expectations, while just nine missed and 21 did better at the top line as well as the bottom one.
This might help to explain why the S&P 500 has rallied by almost 10% from its June low, especially as news of inflation, higher interest rates, war in Ukraine, lockdowns in China and supply chain disruption hardly count as “news” anymore. Moreover, companies are pretty canny when it comes to managing expectations – Mr Silverblatt’s research reveals that an average of 73% of the S&P 500’s members have beaten quarterly earnings forecasts since Q2 2013. Set a low enough bar and anything is possible.
“Analysts are still forecasting increases for aggregate S&P 500 earnings in 2022 and 2023, despite economists’ gathering conviction that the US is heading into a recession.”
The attempted rally may therefore have bigger challenges to come, especially if the surging greenback crimps US exports and decreases the value of overseas sales once they are translated back into dollars (although there could be a benefit in the form of lowered import costs, too). This is because analysts are still forecasting increases for aggregate S&P 500 earnings in 2022 and 2023, despite economists’ gathering conviction that the US is heading into a recession.
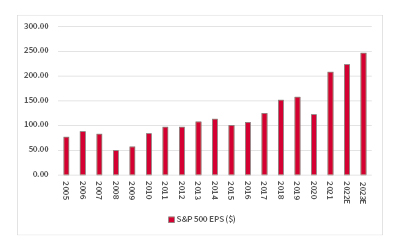
It seems logical to assume that either the economists or the equity analysts are wrong. Consensus estimates are looking for earnings per share (EPS) from the S&P 500 to reach $223 in 2022 and $246 in 2023, compared to $208 in 2021. Investors could be forgiven for thinking that might be a stretch given the current economic backdrop, even allowing for the relatively soft base for comparison offered by last year, which was still suffering from a large bout of COVID-19.
Analysts are looking for healthy earnings growth from the S&P 500

Source: S&P Global, consensus forecasts
Analysts do seem to be having a few doubts. Earnings forecast momentum has ground to a halt. Back in March, the number crunchers had pencilled in $226 for this year and $247 for next, a marked change from the relentless upgrades witnessed over the past year.
“US corporate profit margins are already gently coming off their all-time highs, which begs the question of whether things really can get much better from here.”
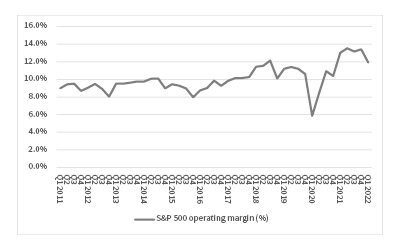
This is understandable, given gathering concerns over the trajectory of the US economy, considering clear signs of inventory build, as well as the dollar and input costs. After all, US corporate profit margins are already gently coming off their all-time highs, which begs the question of whether things really can get much better from here.
US corporate profit margins are already at an all-time high …

Source: S&P Global
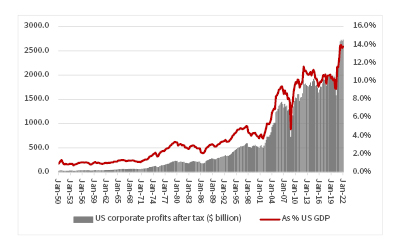
Using another measure, US corporate profits stand at record highs not just in margin and absolute dollar terms, but also as a percentage of GDP. Even allowing for the efficiency with which US firms are run, the lesser protection offered to staff by unions and America’s remarkable ability to reinvent itself, advisers and clients with exposure to US equities could be forgiven for wondering whether this can be maintained, should the economy indeed start to slow.
True believers in free markets will argue that it cannot possibly continue, on the basis that high returns on capital will attract more capital and as competition gathers returns on capital will decrease. In other words, returns will revert to the mean over time, especially if labour starts demanding, and getting, bigger pay increases. Doubters may also point to the contribution made by massive fiscal and monetary stimulus to the latest upward leg in profits and margins.
… as are profits as a percentage of GDP

Source: FRED – St. Louis Federal Reserve database
“The S&P 500’s brief dip into bear market territory earlier this year would suggest that share prices are, as one might expect, well ahead of both economists and analysts.”
It may not pay to overdo the bear case, either. Advisers and clients must remember that the economy is not the stock market and vice-versa. The S&P 500’s brief dip into bear market territory earlier this year would suggest that share prices are, as one might expect, well ahead of both economists and analysts. Cynics might even expect share prices to be rising as they discount, or price in, the next upturn, by the time economists get round to declaring a recession and analysts take the knife to their estimates (should either need to take such action).
Portfolio builders must therefore step back from the noise of quarterly numbers and let valuation be their guide. If US equities are cheap enough, it may not matter how bad the news could be. But if valuations are extended then there may be less downside protection than ideal, especially if upside could be limited, too.
At around 4,000, the S&P 500 looks to trade around 18 times earnings for 2022 and 16 times for 2023. Neither is outlandish relative to US equity markets’ history, although neither multiple smacks of bargain basement territory either, and they do rely on those forecasts of earnings increases for each year.
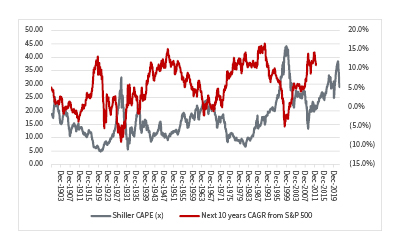
Shiller CAPE ratio still casts a potential cloud

Source: http://www.econ.yale.edu/~shiller/data.htm
“Any time the CAPE ratio has stood at the current 29 times, subsequent ten-year compound returns from US equities have invariably been negative, which is something that long-term asset allocators might need to consider.”
Less encouraging is Professor Robert Shiller’s cyclically adjusted price earnings (CAPE) ratio, which does not rely on forecasts but rolling ten-year average historic earnings, adjusted for inflation. By the professor’s own admission, CAPE is not a tool for timing markets. But any time the CAPE ratio has stood at the current 29 times, subsequent ten-year compound returns from US equities have invariably been negative, which is something that long-term asset allocators might need to consider.
Past performance is not a guide to future performance and some investments need to be held for the long term.
This area of the website is intended for financial advisers and other financial professionals only. If you are a customer of AJ Bell Investcentre, please click ‘Go to the customer area’ below.
We will remember your preference, so you should only be asked to select the appropriate website once per device.