
Equity markets’ rebound from their autumn lows looks quite spectacular. The FTSE All-World is up 16%, the FTSE 100 is up 14% (and battling its way toward new all-time highs) and the only faller among major markets is Brazil, whose BOVESPA index is down nearly 3% since mid-October.
Animal spirits seem to be running again – Bitcoin is up 40% in January alone (even as investigators, lawyers and the courts pick over the bones of Sam Bankman-Fried’s collapsed FTX crypto empire), electric vehicle stocks are motoring and social-media meme stocks such as AMC and GameStop are rising sharply once more.
“It looks and feels like a broad-based, ‘risk-on’ rally, as markets buy into the narrative that inflation is peaking, and global interest rates are set to do the same.”
It looks and feels like a broad-based, ‘risk-on’ rally, as markets buy into the narrative that inflation is peaking, and global interest rates are set to do the same.
However, mood follows price, as the old market saying goes, and advisers and clients must still coolly assess whether this really is the start of the next bull market or merely another wicked bear-market trap that will catch out the unwary and inflict more pain upon them.
There are three reasons for perhaps not getting caught up in the New Year surge.
Bitcoin is trying to break a sequence of lower highs and lower lows

Source: Refinitiv data
“History is littered with painful examples of bear market traps. After the technology bubble of 1998-2000 burst there were no fewer than nine major rallies in the NASDAQ.”
Nine major rallies did not stop the NASDAQ from falling 78% peak-to-trough once the tech bubble burst in 2000

Source: Refinitiv data
However, a change in leadership does not have to be seen in a negative way.
The emergence of a new asset class, or geography, or sector or group of stocks can be a positive, as it means market breadth is improving and no longer reliant upon a select number of market darlings (as rather happened with US equities, with Facebook, Amazon, Apple, Netflix, Alphabet and Microsoft).
Investors and advisers with substantial equity allocations may note with interest how the laggards of recent years – Hong Kong, China, Germany, France and the UK (notably via the FTSE 250) are the new leaders, since the October 2022 lows. Prior leaders, including Brazil, India and the tech-laden US NASDAQ index are now laggards.
“Keen students of US equities will note that the Dow Jones Industrials, previously a plodder, outperformed the NASDAQ by sixteen percentage points in the fourth quarter of 2022.”
Keen students of US equities will note that the Dow Jones Industrials, previously a plodder, outperformed the NASDAQ by sixteen percentage points in the fourth quarter of 2022. That is a startling gap and one that is highly suggestive of a shift in market sentiment, even if the Dow’s recent outperformance looks tiny compared to the preceding fifteen years or so of underperformance relative to the NASDAQ.
The Dow Jones Industrials is currently handily outperforming the NASDAQ Composite
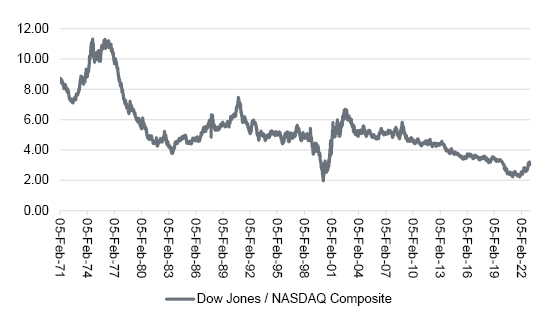
Source: Refinitiv data
The S&P 500’s performance since the October low currently sits between the Dow Jones and the NASDAQ and bulls of US equities may also seek to draw comfort from another statistics (even in the knowledge that the past offers no guarantees for the future).
“The S&P 500 fell by 19.4% in 2022 and there are only two prior examples since 1970 of consecutive annual falls in the index.”
The S&P 500 fell by 19.4% in 2022 and there are only two prior examples since 1970 of consecutive annual falls in the index. This plays to the argument that while, yes, there may be a recession coming in the USA, it is already largely discounted by 2022’s share price falls.
Consecutive annual falls in the S&P 500 index have been relatively rare

Source: Refinitiv data
However, there is a counter-argument here.
The two occasions when the S&P did fall in consecutive years were 1973-74 and 2000-02. In the first instance, inflation, soaring energy prices and rising interest rates were the villains of the piece. In the second, the tech bubble, unsustainable valuations and growth expectations met with rising interest rates and earnings disappointment.
It could be said that both offer parallels with USA equities today, with rising interest rates the common denominator.
Right now, buyers are hoping for help from the US Federal Reserve, in the view that a peak in inflation will permit the American central bank to slow down the pace of interest rate increases, pause them and then finally pivot to rate cuts.
A consensus is gathering that the Fed will only go for a quarter-point rate rise on 1 February, after December’s half-point increase ended a run of four consecutive 0.75% increases in June, July, September and November 2022.
That offers the prospect of the hoped-for slowdown, pause and pivot as well as, perhaps, an end to the $95-billion-a-month Quantitative Tightening (QT) programme, which is also draining liquidity from financial markets.

Source: FRED – St. Louis Federal Reserve database, Refinitiv data
“The US central bank hiked rates from 4.50% to 6.00% in 1999 and 2000 and that had already helped to pull the rug and prompt a repricing of growth stocks. Moreover, the Fed changed course only because the markets and the economy had cracked and not because it was still in full control.”
But even then, advisers and clients must not forget that the NASDAQ’s 1998-2000 bubble collapsed in 2000-2002 even as the Fed was frantically cutting interest rates from 6% to 1.25%. The US central bank hiked rates from 4.50% to 6.00% in 1999 and 2000 and that had already helped to pull the rug and prompt a repricing of growth stocks. Moreover, the Fed changed course only because the markets and the economy had cracked and not because it was still in full control.

Source: FRED – St. Louis Federal Reserve database, Refinitiv data
And while the VIX index is back below 20, to suggest equity investors are getting increasingly comfortable with the economic outlook, its bond market equivalent, the MOVE, looks relatively elevated.
The VIX is pointing toward comfort, even complacency among equity markets …

Source: Refinitiv data
… but its fixed-income equivalent, the MOVE, still looks relatively elevated

Source: Refinitiv data
Fixed-income investors are yet to be convinced that we are out of the woods when it comes to inflation and rate rises. And since major market movements stem from surprises rather than events developing as expected (and thus already discounted and priced in), advisers and clients might like to keep an eye on the MOVE and the US fixed-income markets. A drop in the bond-market volatility gauge could help to confirm equity markets’ faith in twin peaks of inflation and interest rates, but the opposite could warn of more testing times.
Past performance is not a guide to future performance and some investments need to be held for the long term.


This area of the website is intended for financial advisers and other financial professionals only. If you are a customer of AJ Bell Investcentre, please click ‘Go to the customer area’ below.
We will remember your preference, so you should only be asked to select the appropriate website once per device.
