
The rapturous response offered by US equity (and bond) markets to a lower-than-expected inflation print last week (10 Nov) only served to reinforce the importance of the debate over whether or when the Federal Reserve (and other central banks) will pause or pivot on monetary policy. The mere whiff of an easing in the rate of inflation is prompting speculation that central banks will swiftly take the opportunity to stop hiking rates and start cutting them again, so they can stave off (and do not get any blame for causing) a recession.
After a dismal 2022, when share prices have struggled and bond prices have been hammered, it is easy to see why markets are keen to latch on to any good news that they can find. Investors with exposure to US assets will be particularly relieved as, at the time of writing, the price of the benchmark US ten-year Treasury is down by 19% in 2022 and the S&P 500 is down by 17%.
“The US stock market has an uncanny habit of performing strongly in the third year of a Presidential term – and in this electoral cycle, that means 2023.”
But advisers and clients will also be assessing the US political situation, for two reasons. First, the results of the mid-term elections may not be known until December, once the run-off for the Senate seat for Georgia takes place. Second, the US stock market has an uncanny habit of performing strongly in the third year of a Presidential term – and in this electoral cycle, that means 2023.
Using the Dow Jones Industrials as a benchmark, the US stock market has risen by an average of 16.2% in the third calendar year of a Presidential term across eighteen Presidencies going back to Harry S. Truman in 1948-1951.
This compares to the average single-digit percentage gains generated during the first, second and fourth and final years of a Presidency.
The only year when the 30-stock Dow fell during the third year of a Presidency was in 2015, during Barack Obama’s second stint in the White House.
Dow Jones Industrials has, on average, done best in the third year of a Presidential term
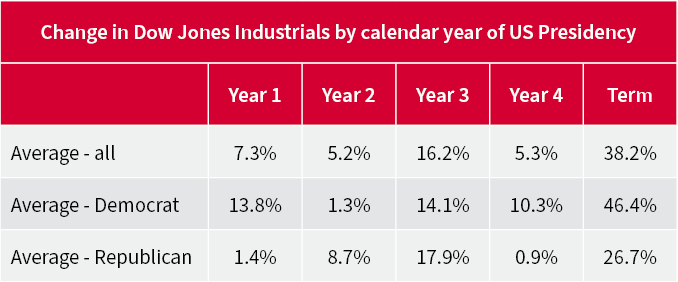
Source: Refinitiv data. Capital returns in dollars. Covers period from Harry S. Truman (1948-1951) to first two years of Joseph R. Biden (2021 to 2022 to date).
“The theory seems to be the incumbent President starts to pull out the economic stops and get the economy firing on all cylinders before they go for a second term, or at least try to lay the foundations for their successor’s campaign for the White House.”
The theory seems to be the incumbent President starts to pull out the economic stops and get the economy firing on all cylinders before they go for a second term, or at least try to lay the foundations for their successor’s campaign for the White House.
The Republicans are still hoping that the mid-term elections give them control of both the House of Representatives and the Senate, but even then, history does not suggest that such an impasse is seen as a negative outcome by investors in US equities.
Four of the six best third years for capital returns from the Dow came when the President, in the form of Richard Nixon, Bill Clinton (twice), Dwight Eisenhower and George W. Bush, had to confront both a House of Representatives and a Senate that were under control of the opposition party. Indeed, financial markets may welcome such checks and balances, in the view that any rash or egregiously foolish policies will be blocked by a logjam on Capitol Hill.
Capitol Hill clashes have not stopped US equities before
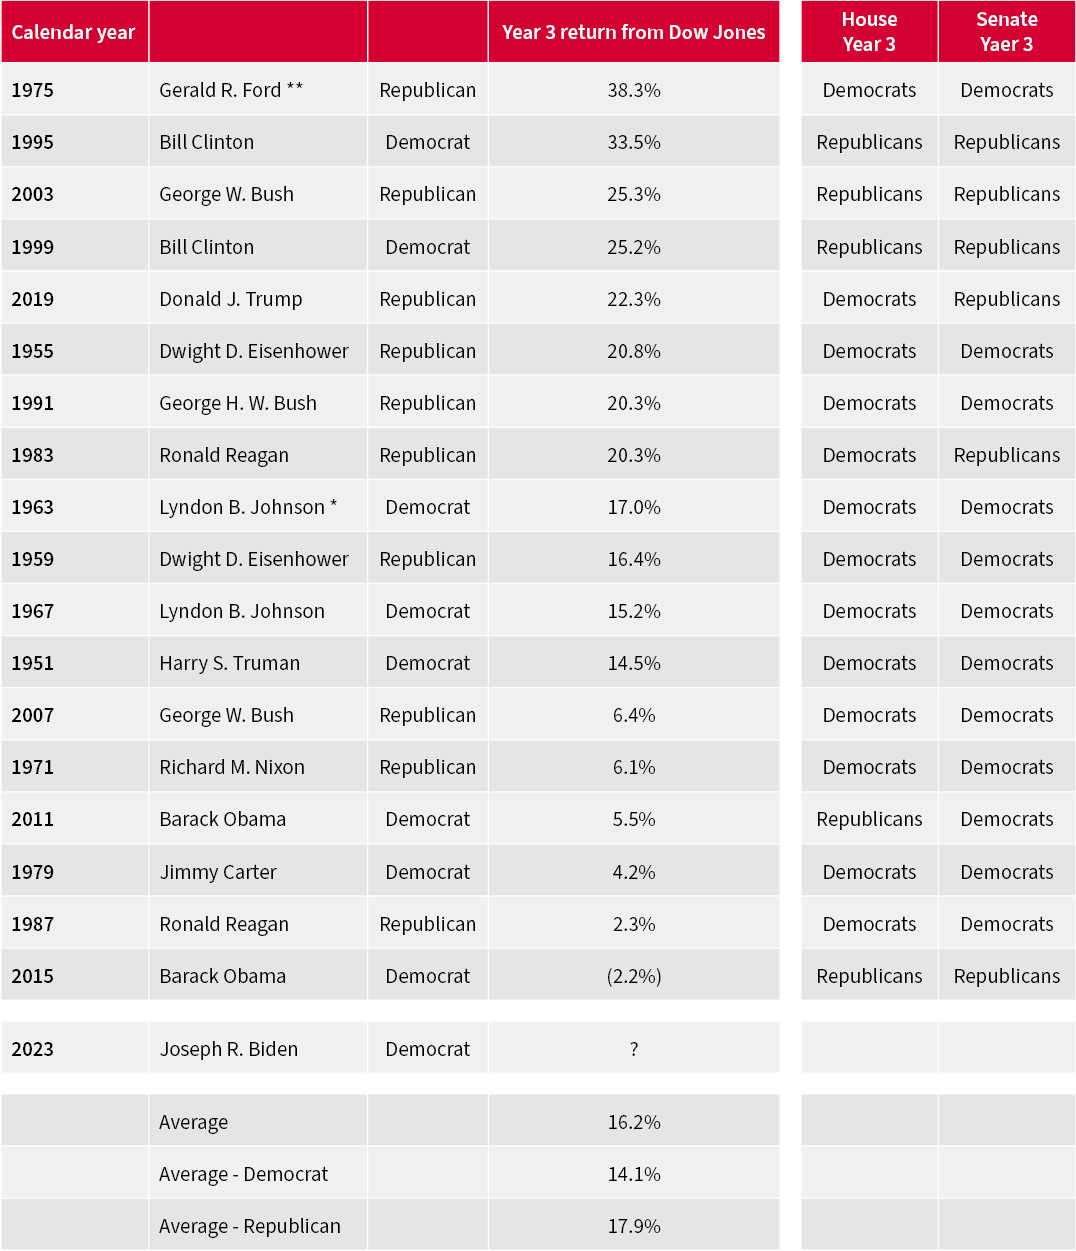
Source: Refinitiv data. * John F. Kennedy assassinated in November 1963 and replaced by Lyndon B. Johnson. ** Richard M. Nixon resigned in August 1974 and replaced by Gerald R. Ford.
However, politics alone is unlikely to shape the fortunes of the Dow Jones and America’s other leading equity indices, as the backdrop to the best (and worst) returns from the third year of a Presidency suggests.
The 1975 bonanza under Nixon’s successor, Gerald Ford, came after the market collapse of 1973-74, while the surge under Bill Clinton in 1995 followed the Greenspan interest rates shock and mid-cycle growth pause of 1994. In 2003 under George W. Bush, the US was emerging from the wreckage of the technology bubble bust of 2000-2002 while in 1999 that bubble was expanding rapidly during the final half of Clinton’s second stint in office.
On the downside, Jimmy Carter’s third year was dogged by a fresh oil shock and another surge in inflation after the fall of the Shah of Iran, while the Black Monday Crash of 1987 took the wind out of the sails of Ronald Reagan’s second term, at least so far as investors were concerned.
US stocks also fell for the only time during a third year of a Presidency under Barack Obama in 2015. Global growth worries, after the bursting of a bubble in Chinese equities, Greece’s debt default and what proved to be a temporary halt in Quantitative Easing in the USA combined to hold back the Dow and buck history at the same time.
“Investors will therefore have to keep a close eye on events in Washington, but an even closer one of inflation, interest rates and corporate earnings growth, as well as valuation, which remains the ultimate arbiter of investment return.”
Investors will therefore have to keep a close eye on events in Washington, but an even closer one on inflation, interest rates and corporate earnings growth, as well as valuation, which remains the ultimate arbiter of investment return – after the 1973-74 collapse and 1994’s stumble, US equities looked good value, at least with the benefit of hindsight, and unfortunately that may not necessarily be the case right now, even after 2022’s US stock market falls.
According to Professor Robert Shiller’s cyclically adjusted price earnings (CAPE) ratio, another major US index, the S&P 500, is still trading on more than 27 times earnings, a valuation multiple that has been historically commensurate with market tops and not market bottoms.
Shiller CAPE suggests US equities are still expensive relative to their history
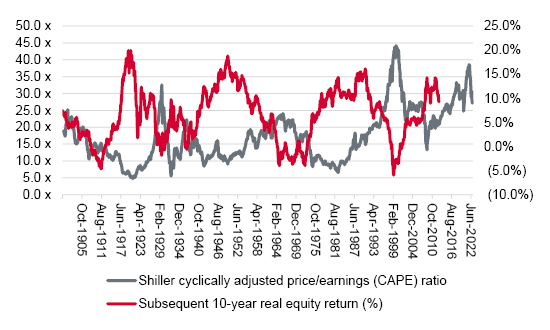
Source: http://www.econ.yale.edu/~shiller/data.htm
Past performance is not a guide to future performance and some investments need to be held for the long term.


This area of the website is intended for financial advisers and other financial professionals only. If you are a customer of AJ Bell Investcentre, please click ‘Go to the customer area’ below.
We will remember your preference, so you should only be asked to select the appropriate website once per device.
