
It has been a strange year for so many industries for so many reasons, and thoroughbred breeding and racing have been no exceptions. Spectators have been barred from racecourses and major meetings have been moved from their traditional calendar slots – Epsom’s Derby was run in July rather than June and America’s equivalent, the Kentucky Derby, took place last weekend (5 September) rather than on the first Saturday in May. Some American punters will be wondering why they bothered with the 146th Run for Roses, as hot favourite Tiz the Law lost, but British fans can at least look forward to the 224th running of Doncaster’s St Leger on its usual date: the second Saturday of September (12 September).
But it will not just be betting-shop punters who will be keeping an eye on the world’s oldest Classic race for three-year-old horses. The staging of the one-and-three-quarter-mile Flat race traditionally marks an end to the summer lull in financial market trading, at least according to the old adage “Sell in May, go away and come back again on St Leger day”.
“The saying about ‘Sell in May’ is based upon how, on average, the UK’s FTSE All-Share index has historically done best between January and April and then again after mid-September, with summer being a bit quiet by comparison.”
This saying is based upon how, on average, the UK’s FTSE All-Share index has historically done best between January and April and then again after mid-September, with summer being a bit quiet by comparison. A similar, if less pronounced, pattern can be seen in America’s benchmark S&P 500 index.
The UK has meekly followed historic trends in 2020 while the US has boldly broken them
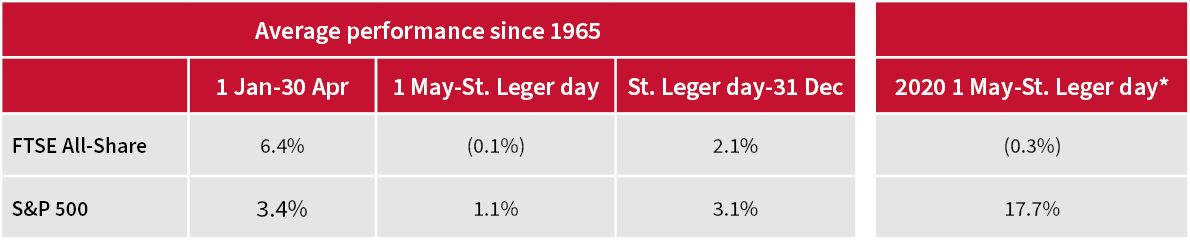
Source: Refinitiv data. 2020 data to 4 September. Capital gains in local currency.
Despite the overall averages, this pattern is not visible every year (investing would be far less difficult if it were). The FTSE All-Share has risen through to the end of April, dropped through to mid-September and then gained until the end of a year on just 15 occasions since 1965. The S&P 500 has followed this trajectory just eight times over the same period.
“In 2020, the FTSE All-Share is pretty much flat since 1 May, in keeping with historic averages, although America’s S&P 500 has actually gained 17.7%, its second-best showing over the 56 years of data studied here.”
In 2020, the FTSE All-Share is pretty much flat since 1 May, in keeping with historic averages, although America’s S&P 500 has actually gained 17.7%, its second-best showing over the 56 years of data studied here. This begs the question of what those respective indices will do for the rest of the year (and then beyond), in the wake of a trends-busting summer on one side of the Pond and a perfectly normal one on the other.
The S&P 500 has actually gained ground on 34 occasions and lost it on just 17 between 1 May and Britain’s St Leger day (an event that is unlikely to resonate stateside anyway). However, it has made a double-digit percentage gain just seven times. The good news for advisers and clients is – at least if history is any guide – the final third of the year saw further advances six times, against just one drop, and there were five gains against just two declines in the following calendar year.
“America’s S&P 500 index has made a double-digit percentage gain over summer just seven times in 56 years. The good news is – at least if history is any guide – the final third of the year saw further advances six times, against just one drop, and there were five gains against just two declines in the following calendar year. The bad news is the two following year declines came when a recession hit, in 1981 and 1990.”
S&P has tended to follow strong summers with more gains
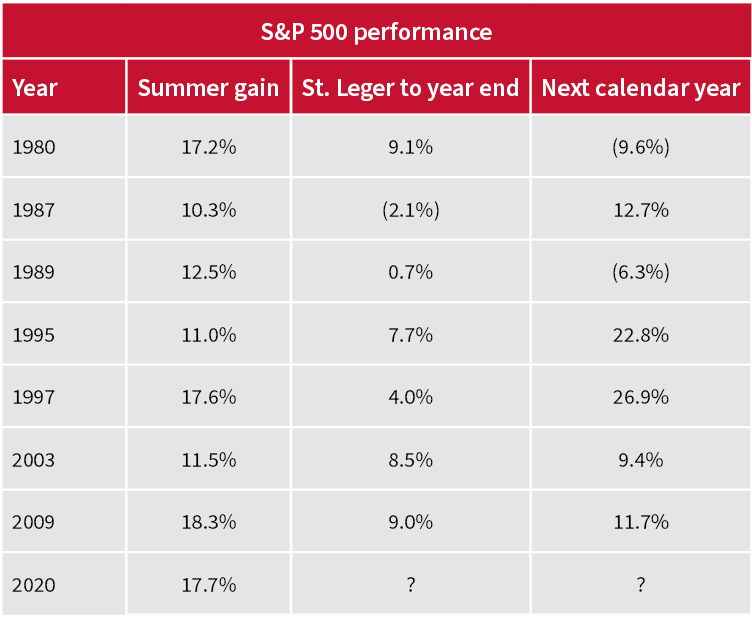
Source: Refinitiv data
Bears will point out, however, that those following-year declines came in 1981 and 1990, when a recession hit America.
As such, rather than points in the calendar, much will depend on how the ongoing pandemic develops and its effect upon the wider economy and corporate earnings and cash flow, as well as central banks’ policy response and how that in turn influences investor thinking.
“The compound annual growth rate (CAGR) in the S&P 500 over the past decade is 12.1% and it is 17.7% for the NASDAQ, levels which have historically preceded a decade of poor (or at least diminishing) returns.”
Even after last week’s stumble, caused by the very same technology stocks which did so much to drag the index higher in the first place, many advisers and clients will take a little comfort from how well the S&P has done historically after a strong summer. Sceptics will counter by saying this is too short a time horizon. The compound annual growth rate (CAGR) in the S&P 500 over the past decade is 12.1% and it is 17.7% for the NASDAQ, levels which have historically preceded a decade of poor (or at least diminishing) returns, so perhaps would-be dip-buyers need to tread carefully after all, depending upon their time horizon.
Past decade of strong returns may not be a reliable pointer to further gains in US indices over next 10 years
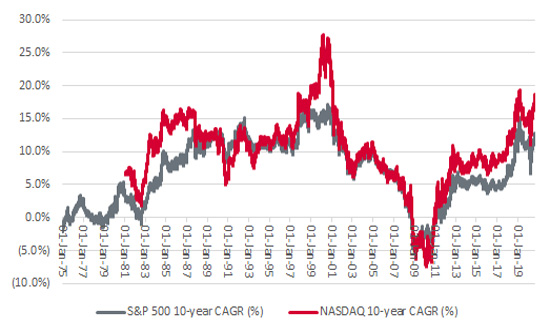
Source: Refinitiv data
The UK has the additional complication of Brexit to address, especially as the UK Government is sticking to its hard line in negotiations with the EU, which perhaps continues to underestimate the Johnson administration’s determination on this topic and its own ability to get 27 members to agree to a plan of their own. You could argue that the uncertainty over what Brexit may or may not mean – whether you approve of it or not – is one reason why the FTSE All-Share has lagged its global peers so badly since June 2016. Advisers and clients seemingly just do not know what will come of it and perhaps they are (still) taking evasive action accordingly.
UK stock market has been a global laggard since June 2016
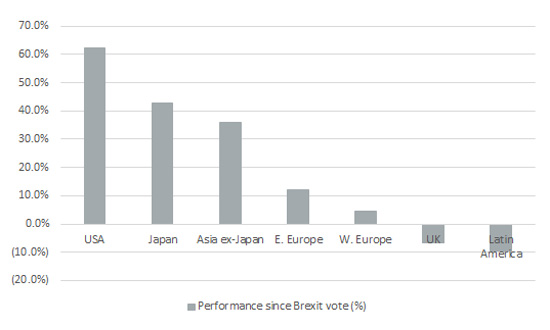
Source: Refinitiv data. Capital gain in local currency terms since 23 June 2016.


This area of the website is intended for financial advisers and other financial professionals only. If you are a customer of AJ Bell Investcentre, please click ‘Go to the customer area’ below.
We will remember your preference, so you should only be asked to select the appropriate website once per device.
