
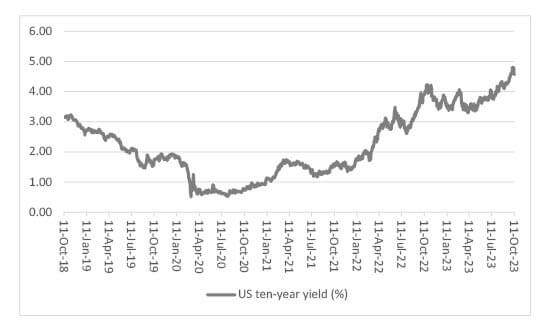
This column has no desire to be seen as a broken clock, stuck and chiming at the same time each day, but it remains convinced that the only chart that matters right now in financial markets is the one that shows the yield on the US ten-year Treasury, or government bond (see this column,30 Jun ’23 and 14 Jul ’23).
US ten-year yields reached a sixteen-year high before the war in Gaza
Source: Refinitiv data
The US ten-year’s vertiginous rise seems to be in abeyance for now, presumably as a result of investors’ search for a haven while they watch events in the Middle East and wonder what the implications are, from the narrow perspective of asset prices. This halt in the ten-year yield is welcome (even if the reasons for it are dreadful and a speedy, peaceful resolution to the Gaza conflict would be cheered by all) but there are three reasons for its advance and three reasons why it matters so much. Investors need to keep a close eye on them all.
“The acceleration in the US ten-year Treasury yields since spring looks to have its origins in three trends.”
The acceleration in the US ten-year Treasury yields since spring looks to have its origins in three trends:
This is a painful combination. Any signs of these trends going into reverse could therefore put a lid on the benchmark ten-year yield, and, at some stage, investors will presumably decide yields have reach such a level that they are just too tempting to ignore, as they more than compensate for the evident risks on offer.
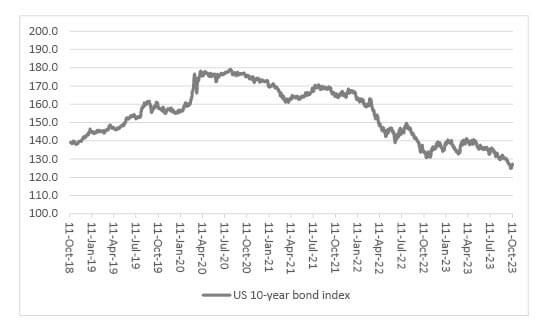
“The future trend in the US ten-year yield matters for three reasons, especially bearing in mind that the US ten-year yield bottomed at 0.51% in August 2020. Since then, the US ten-year bond index has fallen by 29% (since yields and prices have the same inverse relationship for bonds as they do for equities).”
The future trend in the US ten-year yield matters for three reasons, especially bearing in mind that the US ten-year yield bottomed at 0.51% in August 2020. Since then, the US ten-year bond index has fallen by 29% (since yields and prices have the same inverse relationship for bonds as they do for equities).
US ten-year Treasury price index has dropped by more than a quarter from its high
Source: Refinitiv data
US ten-year Treasury price index has dropped by more than a quarter from its high
Source: Refinitiv data
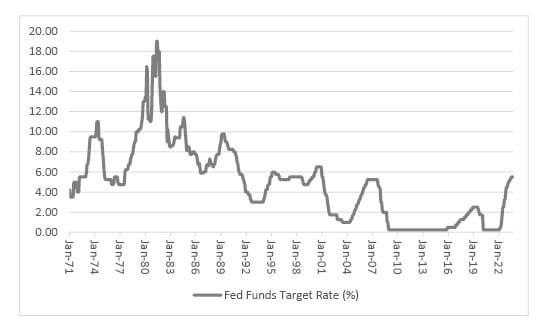
History suggests US interest rates will not stay higher for longer
Source: US Federal Reserve, Refinitiv data
“If history is any guide, the Fed will cut when the markets or the economy can take no more (as the American economist Rudi Dornbusch once argued, ‘None of the post-war expansions died of old age. They were all murdered in their beds by the US Federal Reserve.’)”
That suggests rates may come down quicker than markets currently think. It is tempting to view that as good for equities (as lower yields will reduce the relative attractions of cash and bonds). But perhaps we need to be careful what we wish for. If history is any guide, the Fed will cut when the markets or the economy can take no more (as the American economist Rudi Dornbusch once argued, “None of the post-war expansions died of old age. They were all murdered in their beds by the US Federal Reserve”). However, lower Fed rates did little to support falling share prices during the 2000-03 and 2007-09 bear markets as earnings downgrades outweighed and outpaced lower rates.
Past performance is not a guide to future performance and some investments need to be held for the long term.


This area of the website is intended for financial advisers and other financial professionals only. If you are a customer of AJ Bell Investcentre, please click ‘Go to the customer area’ below.
We will remember your preference, so you should only be asked to select the appropriate website once per device.
