
America’s S&P 500 is up by 11% in the last two months, and the UK’s FTSE All-Share by 10% from the bottoms seen in early October. This may seem counter-intuitive, as the Organisation for Economic Co-operation and Development (OECD), the International Monetary Fund (IMF) and Office for Budget Responsibility (OBR), to name but three, all pile on with forecasts of recession in 2023. And it looks ever odder at a time when one tried-and-tested recession indicator – the yield curve – is also signalling with growing conviction that a downturn is coming and possibly soon. Yet there may be – just may be – method in markets’ apparent madness, despite the apparent contradiction. Investors can then decide for themselves whether they think the method is the right one or not.
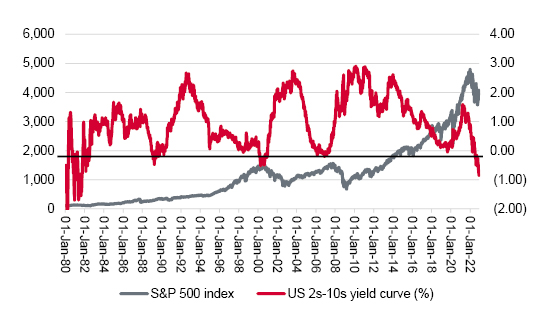
First things first: the so-called yield curve is now deeply inverted in the USA and has just inverted in the UK, using the 2s-10s curve as the benchmark.
Usually, ten-year Government bonds will yield more than two-year paper simply because more can go wrong in the additional eight-year period. Investors will demand a higher yield as compensation for the added risk.
“The US yield curve is deeply inverted, in fact more deeply than since the twin recessions of the early 1980s when then Fed chair Paul Volcker was also jacking up interest rates to crush inflation.”
But when markets sniff out a recession, they start to price in interest rate cuts. Reductions in headline borrowing rates set by central banks will usually drag down yields on Government bonds in sympathy and that is what we are seeing now. Since the 12 October stock market low, the yield on US two-year treasuries is pretty much flat at 4.3% but the yield on ten-year bonds is down 41 basis points (0.41%) to 3.49%. As a result, the US yield curve is deeply inverted, in fact more deeply than since the twin recessions of the early 1980s when then Fed chair Paul Volcker was also jacking up interest rates to crush inflation.
The US yield curve is deeply inverted

Source: Refinitiv data
In the UK, the 2s-10s yield curve for gilts has just inverted. Yields have come down across the board after the panic caused by the nation’s brief flirtation with Trussonomics, but since 12 October the two-year yield is down by 70 basis points and the ten-year by 143.
The UK yield curve has just inverted

Source: Refinitiv data
However, both charts also make it clear that equity markets are not listening to the warnings of recession. They are focusing on the interest rate cuts instead, since they are designed to make credit cheaper, boost loans, oil the economic engine and fuel a fresh upcycle.
“Equity markets are not listening to the warnings of recession. They are focusing on the interest rate cuts instead, since they are designed to make credit cheaper, boost loans, oil the economic engine and fuel a fresh upcycle.”
The theory is that central banks seem to be slowing the rate of interest rate increases, and if rate increases are slowing then they will finally stop, and after they stop then the next logical step is interest rate declines. In sum, this is the argument in favour of a monetary policy pause and then pivot, with the idea being that a recession will help (or force) central banks to stop worrying about inflation and get them to focus on growth instead.
“In effect, markets are calling central banks’ bluff, as they continue to talk tough on inflation and interest rates. You can understand why, given that every major financial market meltdown or economic downturn since the Russian debt default and LTCM hedge fund chaos of 1998 has been met with frantic interest rate cuts and, more recently, dollops of Quantitative Easing (QE).”
In effect, markets are calling central banks’ bluff, as they continue to talk tough on inflation and interest rates. You can understand why, given that every major financial market meltdown or economic downturn since the Russian debt default and LTCM hedge fund chaos of 1998 has been met with frantic interest rate cuts and, more recently, dollops of Quantitative Easing (QE).
Stock (and bond) markets are both latching on to this narrative, making gains even as the economy apparently loses speed. This makes sense in that the stock market and the economy are different things. The FTSE 100 derives the majority of its earnings from overseas for starters. In addition, share prices will try to price in and discount future events, rather than wait for the economic data to come through, especially as most of this will be released with a lag, not least because of the time it takes to compile the numbers.
But it might not be that simple.
An end to yield curve inversion has often called the top in US equities
Source: Refinitiv data
The same happened in the UK ahead of the bear markets that began in 2000 and 2007
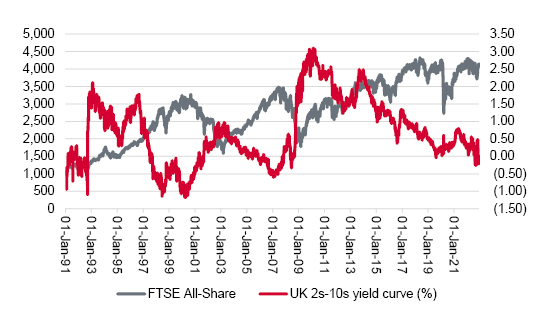
Source: Refinitiv data
“Rate cutting did not initially save investors from a mauling and headline stock indices have tended to top out when the yield curve is at its most inverted and that was because the recession (as predicted by the yield curve) kicked in and took corporate earnings down with it.”
The Fed and the Bank of England slashed interest rates in 2000-2002 and again in 2007-2009 (and launched QE in the latter instance too) and eventually their economies righted themselves and bear markets in shares came to an end – but they key word here is eventually. Rate cutting did not initially save investors from a mauling and headline stock indices have tended to top out when the yield curve is at its most inverted and that was because the recession (as predicted by the yield curve) kicked in and took corporate earnings down with it.
The past is no guarantee for the future, but it seems that the battle lines are set: rate cuts versus earnings downgrades. At least in the UK’s case, valuation multiples and dividend yields feel like they are pricing in deeper drops in earnings than the US market is currently expecting (and analysts are still forecasting higher corporate profits in 2023 on both sides of the pond). We shall see.
Past performance is not a guide to future performance and some investments need to be held for the long term


This area of the website is intended for financial advisers and other financial professionals only. If you are a customer of AJ Bell Investcentre, please click ‘Go to the customer area’ below.
We will remember your preference, so you should only be asked to select the appropriate website once per device.
