
The debate over whether the US equity market is in a bubble continues to rage. The Cyclically Adjusted Price Earnings (CAPE) ratio is one metric that is often cited by the bears and dismissed as past its useful life by stock market bulls. But before advisers and investors can assess the validity of these respective arguments, they must make sure they know how the CAPE works and what it seeks to achieve.
One frequently used valuation metric is the price to earnings (PE) ratio. This is obtained by dividing the share price by historic or forecast earnings per share (EPS). In effect, the multiple reflects how long it will take a company to earn its current stock market valuation in annual after-tax income, assuming no further growth.
Crudely put, the lower the ratio, the cheaper the shares, and vice-versa. The PE can be assessed in absolute terms, or relative ones – stocks can be judged relative to their own history, the local index of which they are a part or domestic or global peers.
Investors tend to use future earnings estimates and base their valuation judgements on the ‘forward’ PE, to try and capture future growth prospects, since stock markets do not tend to look backward and are forward-looking discounting mechanisms that try to ‘price in’ future events.
However, this is where trouble can start. Cyclicals, or companies whose business is particularly sensitive to GDP growth, show the highest profits, and thus the lowest PE multiples, at the peak of the cycle and their earnings – just before a downturn in their fortunes and probably their share price.
They also tend to look most expensive when the economy and their profits are depressed and things are about to get a lot better, including their share price. Even without those swings and roundabouts, analysts’ future earnings forecasts tend to be wrong, either because they are too high, or too low, or because they extrapolate current trends which can be easily knocked off course by the unexpected.
Professor Robert J. Shiller devised and compiled the CAPE data to iron out some of these wrinkles and take a longer-term view to try and cut through any cyclical noise. The CAPE takes the share price, or index level, and divides it by the average of the past 10 years’ inflation-adjusted earnings.
Adherents like CAPE, because it takes a long-term view, looks at a company’s or index’s trend earnings power and considers cyclical highs and lows. It also incorporates how capitalism, when it works well, will ensure that supra-normal profits do not last long and revert to the mean, as competition comes looking for its piece of the action and reduces returns on capital over time.
Sceptics hate CAPE, because it is backward-looking. They will also argue the US, and the West, are no longer reliant upon capital-intensive manufacturing industries but asset-light ones, such as social media networks, software and artificial intelligence.
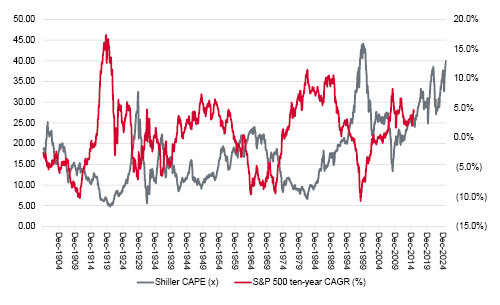
Source: LSEG Refinitiv data
This takes us to the debate about the current CAPE multiple for the S&P 500, which is around 40 times. The S&P 500 has only previously traded above 30 times on two prior occasions. Those bull runs were fun while they lasted, but neither episode ended well for investors. The first was in summer 1929, just before the October Wall Street crash and the second in 1999-2000, just as the technology, media and telecoms bubble reached its peak and got ready to pop.
In this respect, it seems like an open-and-shut case that the Shiller CAPE is warning of danger. After the initial collapse in autumn 1929, the CAPE multiple contracted to barely six times in summer 1932, to show the extent of the pain inflicted upon those who bought into the new-era thinking of the late 1920s, when technological advancement (in this case wireless radio, best captured by Radio Corporation of America stock) combined with arguments that valuation did not matter.
However, the S&P 500 bottomed on a CAPE rating of around 21 in spring 2003 once the TMT bubble burst and it hit a low of 15 times when sentiment was washed out in 2009 at the end of the bear market caused by the Great Financial Crisis.
These much higher ‘trough’ ratings, the current dominance of a handful of seemingly impregnable stocks and the long bull market, whose origins go back some 16 years, prompt bulls to assert the CAPE is no longer relevant. Since 2013, the CAPE has barely dipped below 25, a level previously associated with market tops.
The battle lines are drawn. Shiller himself freely acknowledges that the CAPE is not meant to be a tool for timing the near-term movements of markets. Decade-long arguments that the US equity market is overvalued based on the methodology are leaving many bears red-faced and out of pocket.
But the CAPE does have a good history of giving a feel for what long-term returns from US equities may be.
Simply put, the higher CAPE goes, the lower the compound annual growth rate (CAGR) over the next decade, and the lower CAPE goes, the better the 10-year returns. This is the iron law of maths and valuations, although it gives no clue as to the trajectory or degree of volatility over the decade. Taking Shiller’s work at face value, it seems unlikely that US stocks will do as well in the next 10 years as they have the last 10, but only time will tell.
Past performance is not a guide to future performance and some investments need to be held for the long term.


This area of the website is intended for financial advisers and other financial professionals only. If you are a customer of AJ Bell Investcentre, please click ‘Go to the customer area’ below.
We will remember your preference, so you should only be asked to select the appropriate website once per device.
