One of the biggest and most pleasant surprises of 2026 to date is the sanguine manner in which the oil price continues to respond to the ongoing tensions between America and Iran.
A barrel of the European benchmark product, Brent Crude, for one-month delivery trades at $72 a barrel at the time of writing, no higher than when the US and Israel launched their initial strikes on 28 February. After a brief surge to $120 a barrel, Brent is also no higher than five years ago, when the world was just starting to stagger out of lockdowns.
Renewed oil price weakness – or at least the marked absence of oil price strength – is a bonus for consumers’ confidence and spending power, as well as corporate input costs and thus profit margins across a range of industries. Add in expectations for modest interest rate increases, at worst, and two key sources of fuel for an equity bull market, cheap energy and cheap money, seem abundant – but advisers and clients still need to check that both will remain so on a sustainable basis.
Source: LSEG Refinitiv data.
For now, markets expect only modest interest rate increases from the US Federal Reserve, the Bank of England, and European Central Bank, even if there is a consensus that the Bank of Japan is behind the curve and should be doing more to rein in inflation.
Helped by the oil price’s retreat, the US five-year forward inflation expectation is just 2.2%. That is only a fraction above the US Federal Reserve’s target, despite an uncomfortable run of monthly readings above that level which dates back to early 2021.
If inflation expectations remain anchored, that could help the monetary authorities keep a lid on headline borrowing costs. It is also easy to see why central banks would wish to avoid any steep increases in interest rates, given the levels of borrowing across government, corporations, and consumers alike and therefore the likely hit to spending and growth that could follow.
Source: FRED – St. Louis Federal Reserve database, Bank of England, US Federal Reserve, CME Fedwatch, LSEG Refinitiv data
The oil price rocketed as war broke out in the Middle East earlier this year. However, the increase was neither as substantial or as sustained as the oil price shocks of 1973-74, 1979 and 1990, or even the bull run of the early 2000s, when strong economic growth, dollar weakness and concerns over supply after a period of low capital investment in response to the price collapse of the late 1990s combined to drive crude to an all-time high of $147 a barrel.
Calm quickly returned after Russia’s 2022 attack on Ukraine, too, with the result that the oil price had little lasting impact on global growth or monetary policy.
However, inflation remains above target to this day, to mock policymakers’ assertion of four and five years ago that this would prove a ‘transitory’ issue.
Energy prices could thus yet have a major say upon both the cost of money, the potential returns offered by cash and bonds relative to equities and thus financial markets.
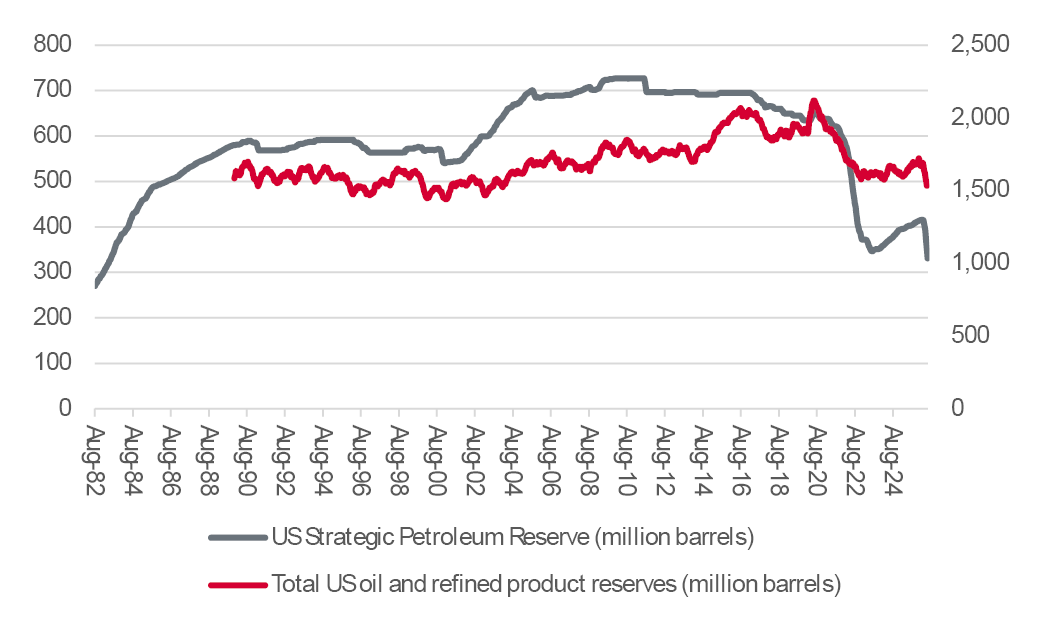
The case for stable, or even weaker oil and gas prices is based upon four key thrusts:
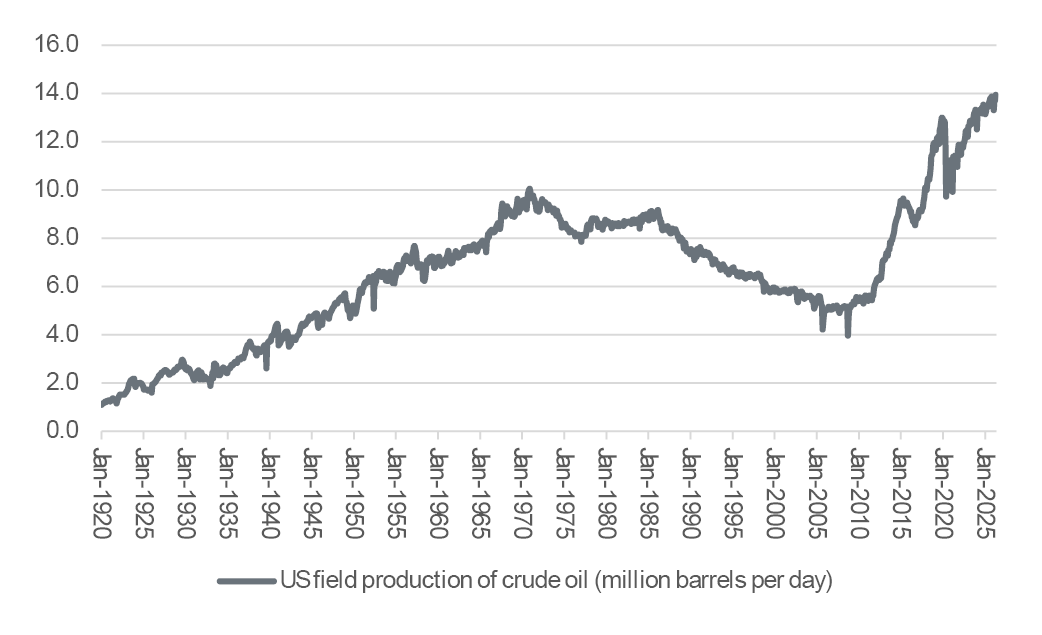
Source: US Energy Information Administration
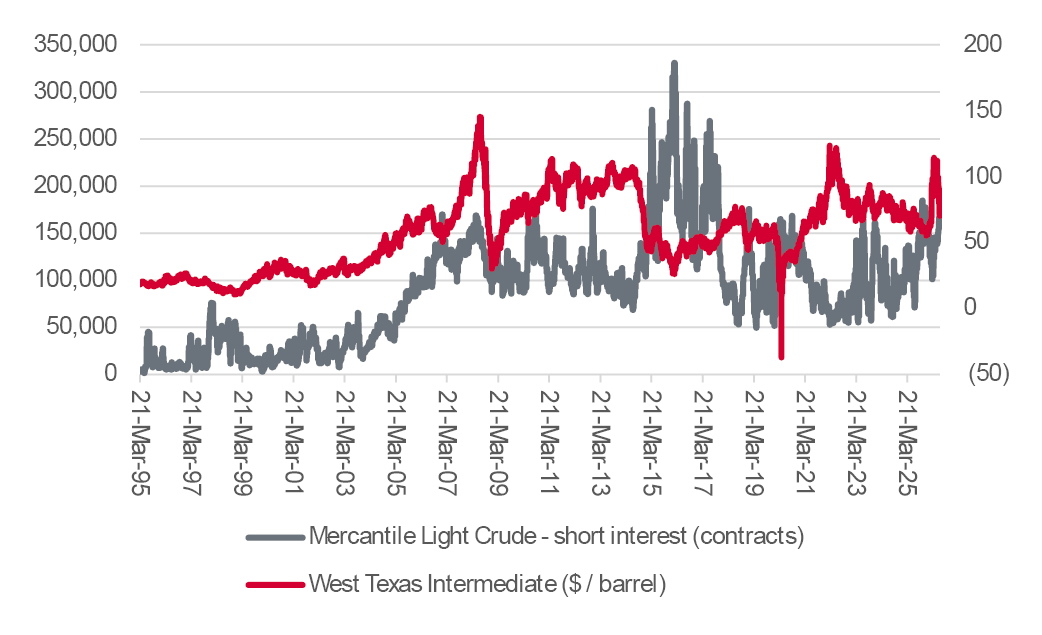
There are, however, four counter-arguments:
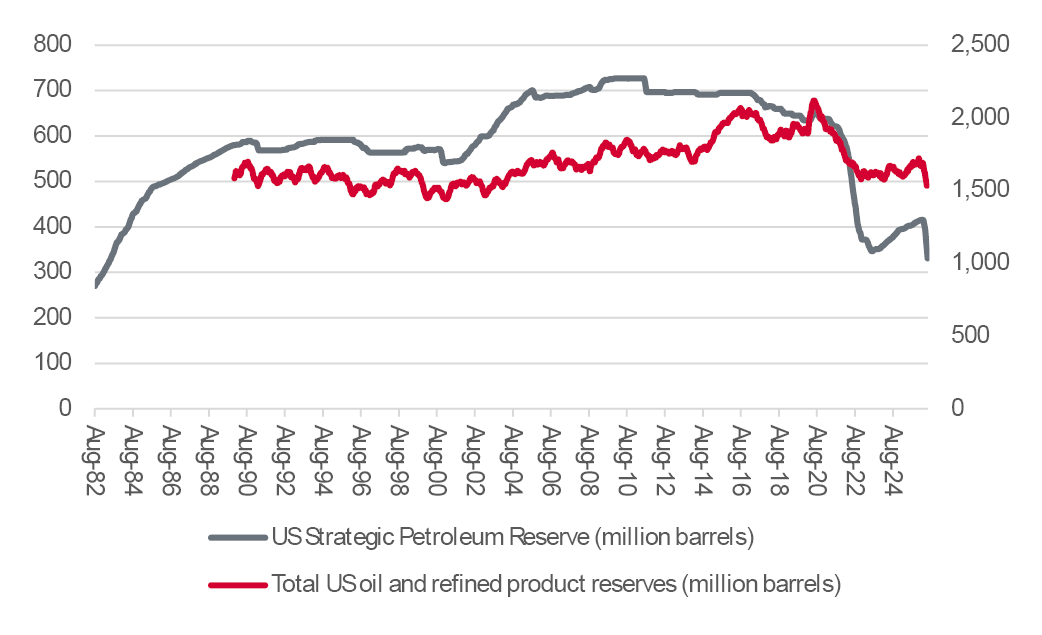
Source: US Energy Information Administration
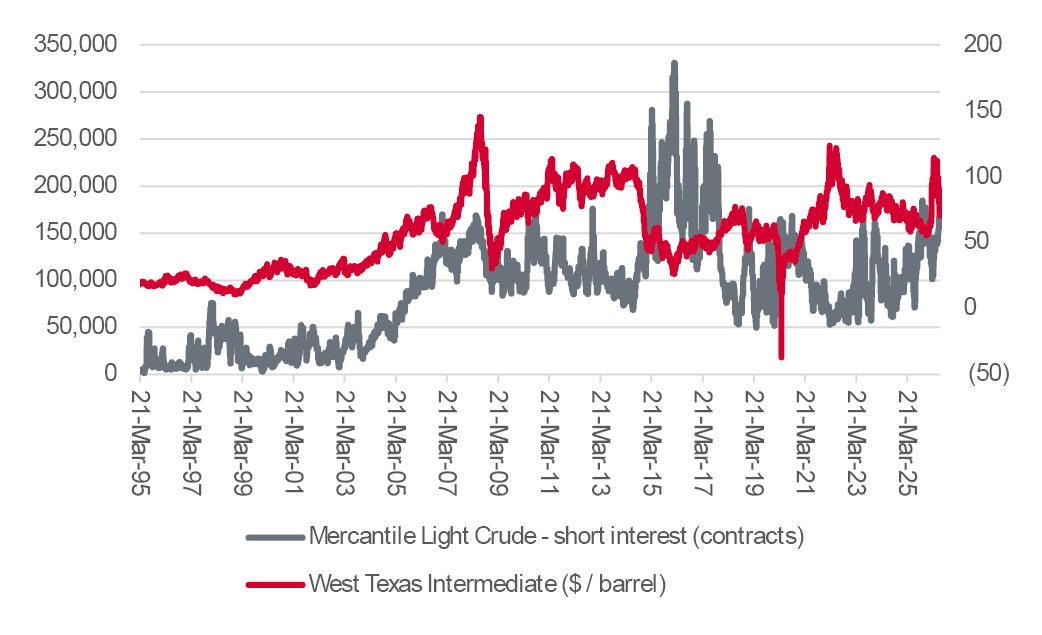
Source: LSEG Refinitiv data, US Commodity Futures Trading Commission
Advisers and clients can use both checklists to see how their strategic portfolio allocations and positions could yet be affected, in the knowledge that the current consensus view leans toward the first one. As such, any major surprises are likely to come from the second list, and unexpected oil price strength, or at least renewed volatility.

Past performance is not a guide to future performance and some investments need to be held for the long term.



This area of the website is intended for financial advisers and other financial professionals only. If you are a customer of AJ Bell Investcentre, please click ‘Go to the customer area’ below.
We will remember your preference, so you should only be asked to select the appropriate website once per device.