
A second wobble in US equities in seven months, following the summer squall of last August, is creating a fair degree of noise, if not panic.
“The S&P 500 is back to where it was in late August, the NASDAQ in mid-September, but such pullbacks, in recent times, have simply been chances to ‘buy on the dip,’ goes the bullish thesis.”
Dyed-in-the-wool bulls will assert that the S&P 500 is down by just 9% from its high (at the time of writing), while even the NASDAQ’s 13% slide is no great drama in the context of the bull run seen since the COVID-inspired lows of early 2020. The S&P 500 is back to where it was in late August, the NASDAQ in mid-September, but such pullbacks, in recent times, have simply been chances to ‘buy on the dip,’ goes the bullish thesis.
US equities are back to where they were just six months ago
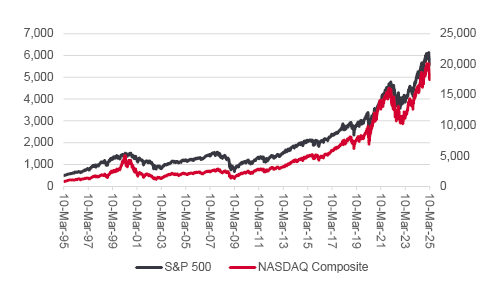
Source: LSEG Refinitiv data.
Bears will have a different take. They will point to the almost parabolic gains of the past two years and the accompanying rise of meme stocks, one-day options trading, a new all-time high in margin debt in the US and what they would assert are many other classic features of markets that are becoming overheated – complexity, opacity and leverage (debt), right up to a leading figure in the cryptocurrency world buying and then eating a piece of art for which he paid $6.2 million.
For anyone worrying about the gentleman’s digestive system, the ‘art’ was a banana taped to a wall, but such devil-may-care behaviour does not usually characterise market bottoms, or end well. As John Maynard Keynes once tartly observed, “When the capital development of a country becomes a by-product of a casino, the job is likely to be ill-done.”
However, no-one, but no-one can time market tops (or bottoms) to perfection – even Warren Buffett was one to two years early when he went heavily to cash in the late 1990s and then again in the middle of the first decade of the new millennium ahead of the smashes of 1998-2000 and 2007-09.
“One measure that could help advisers and clients test the market mood is volatility. The more we get of it, as crudely measured by the number of daily moves of more than 1%, 2% and 5% to the downside or upside, the less healthy the market probably is, at least if history is any guide.”
One measure that could help advisers and clients test the market mood is volatility. The more we get of it, as crudely measured by the number of daily moves of more than 1%, 2% and 5% to the downside or upside, the less healthy the market probably is, at least if history is any guide. In this respect, a little more conversation and a little less action may be no bad thing, both on the Stock Exchange and in the White House.
The timing of the latest US equity market stumble, be it no more than that or a warning of something more malign, is notable for how it coincides with the twenty-fifth anniversary of top in the technology, media and telecoms bubble. The NASDAQ Composite peaked at 5,048 on 10 March 2000. It troughed at 1,114 on 9 October 2002 and then took thirteen years to recoup that crushing loss.
“One sign that trouble may have been coming in 2000 was how volatility started to increase.”
One sign that trouble may have been coming in 2000 was how volatility started to increase. As valuations became extended, even when based on very bullish earnings growth forecasts, any minor departure from the bullish script caused share prices to slide, only for the bullish narrative to reassert itself. Again, this can be seen in how the number of one-day, open-to-close movements in excess of 1%, 2% and 5% became increasingly prevalent, even as the NASDAQ doubled in a year.
The NASDAQ became more volatile as it approached the 2000 peak
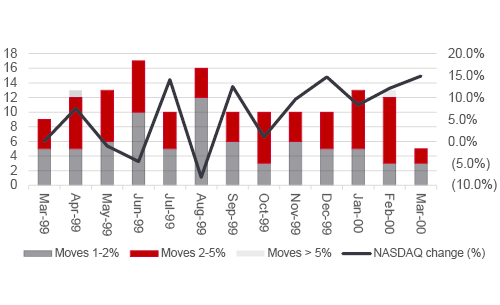
Source: LSEG Refinitiv data. From 10 March 1999 to 10 March 2000, with the 10th of each month as the starting point.
Worse was to follow. Volatility soared – the NASDAQ by more than 1% on an open-to-close basis on 196 occasions in the next 260 trading days, with 115 gains or drops between 2% and 5% and 31 swings of more than 5%.
The NASDAQ became even more volatile as the bear market began
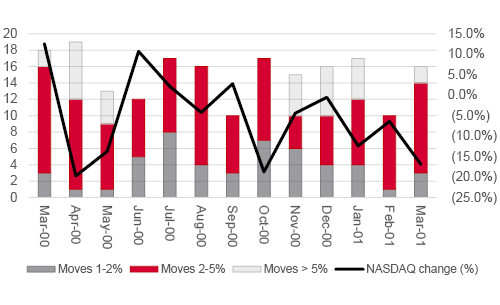
Source: LSEG Refinitiv data. From 11 March 2000 to 10 March 2001, with the 10th of each month as the starting point.
“From 2000’s peak to 2002’s trough, the NASDAQ had 446 days where it rose and 440 where it fell. The best daily gains were bigger than the worst daily falls, but the bears won out over the bulls as they grappled for control.”
Rallies were bear traps in disguise, as the index ground lower and that punishment forced more and more bulls to throw in the towel over the next thirty-one months. From 2000’s peak to 2002’s trough, the NASDAQ had 446 days where it rose and 440 where it fell. The best daily gains were bigger than the worst daily falls, but the bears won out over the bulls as they grappled for control.
NASDAQ’s biggest daily gains outshone its losses in the 2000-03 bear market
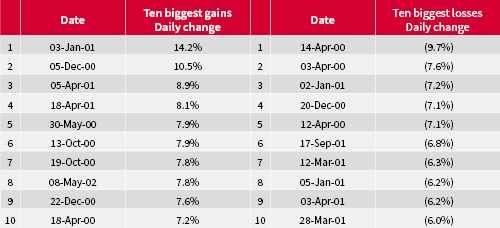
Source: LSEG Refinitiv data, taken between 10 March 2000 and 9 October 2002.
The worrying sign now is that volatility is picking up again (and it can even be traced back to a tricky August, like that of 1999).
The NASDAQ became even more volatile as the bear market began
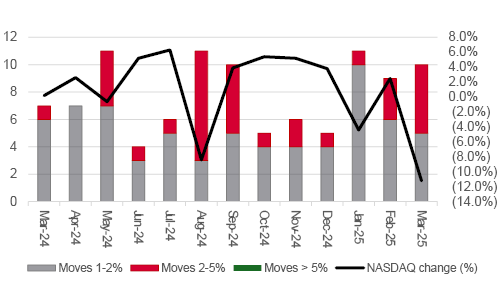
Source: LSEG Refinitiv data. From 10 March 2024 to 10 March 2025, with the 10th of each month as the starting point.
There is one massive difference between 2025 and 2000, though, namely that the NASDAQ is up by just 9% over the past year. It can be argued the environment is not as frenzied now as it was in 2000, even allowing for hot spots like AI and memes.
Bears may grab that one, too, mind you. One shrewdie is pointing out on social media that shares in Microsoft (MSFT:NDQ), the poster child for investment in AI, are unchanged since January 2024 (after a near-20% slide from last July’s peak). Gold is up 50% in the same time frame. Maybe the market mood is changing after all.
Past performance is not a guide to future performance and some investments need to be held for the long term.


This area of the website is intended for financial advisers and other financial professionals only. If you are a customer of AJ Bell Investcentre, please click ‘Go to the customer area’ below.
We will remember your preference, so you should only be asked to select the appropriate website once per device.
