
America’s S&P 500 stock market index is down just 5% so far in 2020 and it is up 5% compared to its level of a year ago. Given everything that the world continues to throw at it – COVID-19, a deep economic downturn, social unrest, ongoing trade tensions with China and apparent chaos in the White House (depending upon whose memoirs or Twitter feed you read) – this seems nothing short of remarkable.
There are several possible explanations for this, including the powerful role played by Facebook, Alphabet, Amazon, Apple, Netflix and Microsoft, in terms of their market caps (nearly a quarter of the S&P 500 on their own) and earnings; tentative signs of recovery in economic indicators such as weekly jobless claims, retail sales and purchasing managers indices; and substantial support for the economy in the form of fiscal stimulus from Congress and equally aggressive monetary policy from the US Federal Reserve.
“President Trump is promising more action, in the form of a further $1 trillion spending plan, but it is a subtle shift at the Fed which may be the most important trend for US equity markets right now.”
The latest test of technology’s ability to support the US equity market will come when that sextet reports its next set of quarterly earnings in late July. The economic data will continue to roll in and further improvement is needed here, as few – if any – indicators are within 10% of their all-time peaks, unlike the S&P 500. Meanwhile, President Trump is promising more action, in the form of a further $1 trillion spending plan.
But it is a subtle shift at the Fed which may be the most important trend right now.
This column has pointed out before (8 May 2020) the coincidence that the S&P 500 index bottomed at 2,237 on the very day that Federal Reserve chair Jay Powell further expanded the size and range of Quantitative Easing (QE) to include, not just Treasury bonds and asset- and mortgage-backed securities, but corporate bonds too. Since March, the Fed’s balance sheet has expanded by some $2.5 trillion and share prices have ripped higher.
“Since March, the Fed’s balance sheet has expanded by some $2.5 trillion and share prices have ripped higher. However, the rate at which the Fed’s balance sheet has expanded began to slow in May and last week (to 17 June) it shrank for the first time since February.”
However, the rate at which the Fed’s balance sheet has expanded began to slow in May and last week (to 17 June) it shrank for the first time since February. The decline was only small – some $74 billion – but that was a far cry from the huge weekly increases of the spring.
Fed’s tidal wave of liquidity is starting to dry up
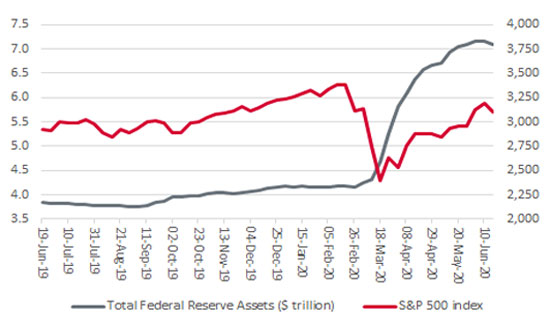
Source: FRED – St. Louis Federal Reserve database, Refinitiv data
This will be a key test for the theory that Fed liquidity is the main reason why US equities are doing so well in the face of so many challenges. The S&P 500 does at least look to be pausing for breath so – if that theory is right – it will fall to fiscal stimulus, momentum in macro data and, above all, corporate earnings and cash flow to take up any slack.
Advisers and clients can use three indicators as a guide to how the market is seeing the interaction between those three trends and US equity valuations.
The first is the Dow Jones Transportation index, since Dow Theory notes that the Dow Jones Industrials (and, by implication, the wider US stock market) cannot get far if the transport stocks are failing to fire. The transports have lagged since 23 March, 1 January and over one year, so bulls will want to see them build up fresh steam.
Dow Jones Transport index is lagging the Industrials
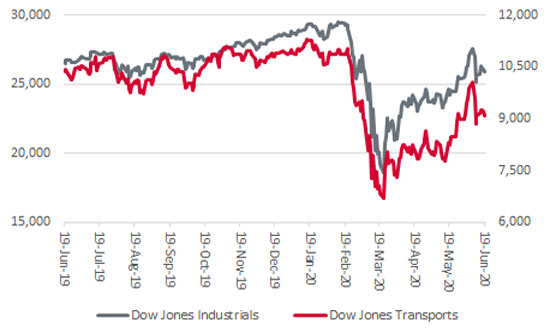
Source: Refinitiv data
The second is the Russell 2000 small cap index. Small caps tend to be more closely tied in to the economic fortunes of their home market and their share prices tend to be a good guide to the level (or lack) of risk appetite amongst investors. The Russell has outperformed the Dow Jones’s mega caps over one year and its recent loss of momentum could be down to fears of a second wave of COVID-19 in the US as much as it is to the Fed stepping back.
Small caps may be pausing for breath after strong run
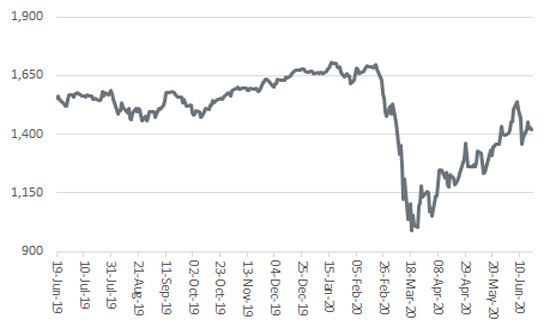
Source: Refinitiv data
Finally we come to the yield curve, the difference in yield between the two-year and ten-year US Government Treasury bonds. A steepening curve usually foretells of accelerating economic activity, and even inflation, while a flattening one is often seen as a warning of a slowdown. The yield curve has steepened and the recent flattening may also be due to fears of a second wave as much as the Fed’s move to stop adding to QE.
US yield curve has steepened since autumn
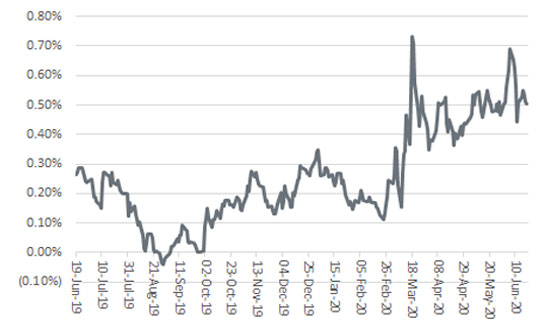
Source: Refinitiv data
“If the yield curve continues to steepen, that would suggest markets are thinking about inflation in the longer term, thanks to the combination of monetary and fiscal stimulus poured into the economy by the Fed and Congress.”
If the yield curve continues to steepen, that would suggest markets are thinking about inflation in the longer term, thanks to the combination of monetary and fiscal stimulus poured into the economy by the Fed and Congress. That could be the most telling trend of all. If history is any guide (and there are admittedly no guarantees), periods of inflation mean advisers and clients need hard assets (commodities and property) and ‘value’ areas like cyclicals, financials and emerging markets. By contrast, they would need to shun bonds and ‘growth’ stocks. In other words, do the direct opposite of what has worked for the last decade.


This area of the website is intended for financial advisers and other financial professionals only. If you are a customer of AJ Bell Investcentre, please click ‘Go to the customer area’ below.
We will remember your preference, so you should only be asked to select the appropriate website once per device.
