
AJ Bell Investments recently launched its Responsible MPS range. This was on the back of the launch of the Responsible Growth Fund launch in November 2020. Following strong investor demand, increasing regulation – such as SFDR (sustainable finance disclosure regulation) – and, perhaps most importantly, growing product availability, we felt it was the right time to launch the range.
In 2020 alone, ESG-focused ETFs nearly tripled in assets, reaching $210 billion by the end of February 2021 according to TrackInsight.
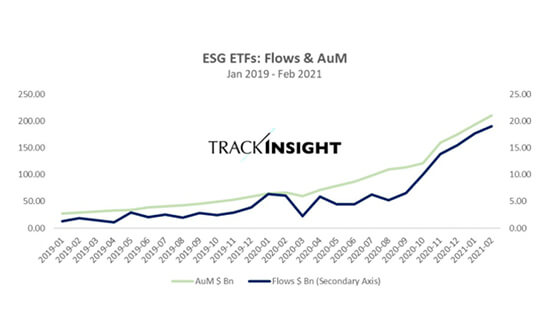
In the fourth quarter of 2020, 98 new ESG-focused ETFs were launched globally, bringing the total to over 500 – with the vast majority of these domiciled in Europe, where ESG investing is proving popular.
However, with choice comes complexity.
For broad exposures such as UK equities or US equities, consensus has emerged over several decades as to which indices represent these asset classes. For example, the FTSE 100 or the S&P 500.
However, for ESG exposures, given the rapid expansion of the theme and the myriad of product launches, different indices are available for the same asset class. For example, we outline below a sample of ESG ETFs tracking US equities.
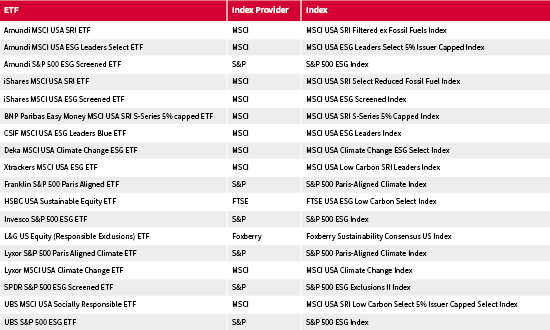
This means when building a responsible portfolio, it is important to get under the hood of the products invested in. We provide some examples of these differences and explain how we navigate these issues within the AJ Bell Responsible MPS range.
One input into all these products is ESG ratings. These are computed by companies such as MSCI, Sustainalytics, ISS and FTSE. It is often thought that an ESG rating would be black and white – a company is either good or bad. However, ESG ratings should be thought of in a similar way to credit ratings or equity analyst ratings – there is some shared consensus, but due to different methodologies and different interpretations of the same qualitative and quantitative data, different rating agencies can draw different conclusions about the same companies. A good example is Tesla – this could be deemed to be a ‘good’ ESG company due to the product it sells – electric cars. On the other hand, it could be judged to be a ‘bad’ company due to perceived bad governance.
The UN PRI calculated the average correlation across six ESG rating providers was 0.46, lower than many would expect.
Average Pearson Correlation between ESG ratings
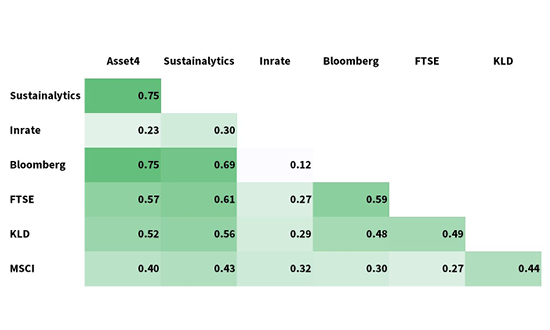
Source: Swiss Financial Institute, February 2021
We look at three separate ETFs – the UBS MSCI USA Socially Responsible ETF, the HSBC USA Sustainable Equity ETF and the SPDR S&P 500 ESG Screened ETF. These use different ESG rating companies as part of the index methodology. The graphic below shows the overlap between the three indices in terms of shared weightings.
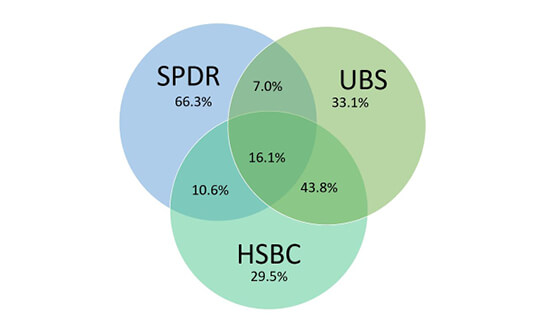
Source: State Street, UBS, HSBC, AJ Bell analysis, March 2021
It is likely to come as a surprise that shared weightings across all three indices total less than 20%. There is decent crossover between UBS and HSBC, totalling around 60%, but this still means around 40% of the weights are different.
It is not just the ESG ratings that cause these weighting differences. It is also driven by issues such as the starting index, sectors excluded, and the approach to issues such as sector weights and weighting methodology.
MSCI dominate in terms of family of index tracked in the US equity example, but when looking at the actual index, different indices are tracked. This is not always obvious from the ETF name. For example, both Amundi and Blackrock have an ETF with MSCI USA SRI in the name, but they track slightly different indices.
These seemingly minor differences can have a very big impact on the underlying characteristics of the ETF – and are very difficult to spot from the name alone.
Undertaking the same analysis as before, using the Amundi and iShares MSCI USA products, we see that about 5% of the weightings are different, despite the almost identical ETF names.
One of the key questions over the last couple of years has been around the performance of ESG indices against standard indices. Studies have varied, and the consensus is that integrating ESG factors does not detract from performance. However, herein lies the challenge – which of the products above is a fair representation of USA ESG equity? If an average is taken, are performance differences due to ESG choices, or other factors?
One of the obvious unintended biases within an ESG index may be sector positioning. If we look at the HSBC USA Sustainable equity ETF, we observe that its technology share weighting is significantly higher that the starting index (38% vs 28%). This means that the performance of certain sectors drives performance differences, not just the ESG choices. As well as sector differences, other characteristics may vary, such as average market capitalisation, style and – for regional products – country breakdown.
On the other hand, the MSCI indices aim for sector neutrality, but in practice this rarely happens, either due to certain sector exclusions (for example alcohol and tobacco), or extra filters applied after this stage, such as a targeted carbon reduction.
As such, we do not draw any conclusions on the performance of ESG strategies, however it does mean that, when constructing our responsible range – including the fund and the MPS – we often take a similar approach taken by an active multi-asset strategy. In our emerging market exposure, we blend different ETFs together to ensure we have the right balance of sectors and countries; using a single product can lead to a very high tracking difference to the parent index, as often China is underweighted due to lower ESG scores.
When building our range of portfolios, we have tried to account for the complexities of ESG indices by following a set of principles:
This area of the website is intended for financial advisers and other financial professionals only. If you are a customer of AJ Bell Investcentre, please click ‘Go to the customer area’ below.
We will remember your preference, so you should only be asked to select the appropriate website once per device.