
For much of the past decade, if you’d asked someone to name the best-performing asset class over the previous year, they would likely have confidently answered: US equities. However, if we are to be more nuanced and think about the returns received by UK based investors, i.e. in sterling terms, US equities have only been a top performer in four of the ten years leading up to the end of August, as shown in the ‘patchwork’ of returns below.
The interplay of currency has a significant influence on returns over the decade, particular in 2025 and 2016. This year a weaker US dollar has hindered US equities within UK investor portfolios (assuming there’s no currency hedging in place, which is often the case). The reverse was true after the Brexit referendum in the summer of 2016, as the depreciation of the pound raised returns on overseas investments across the board.
The ‘patchwork’ of one-year returns is evidence of just how unpredictable markets can be in the short term.
1-year total returns
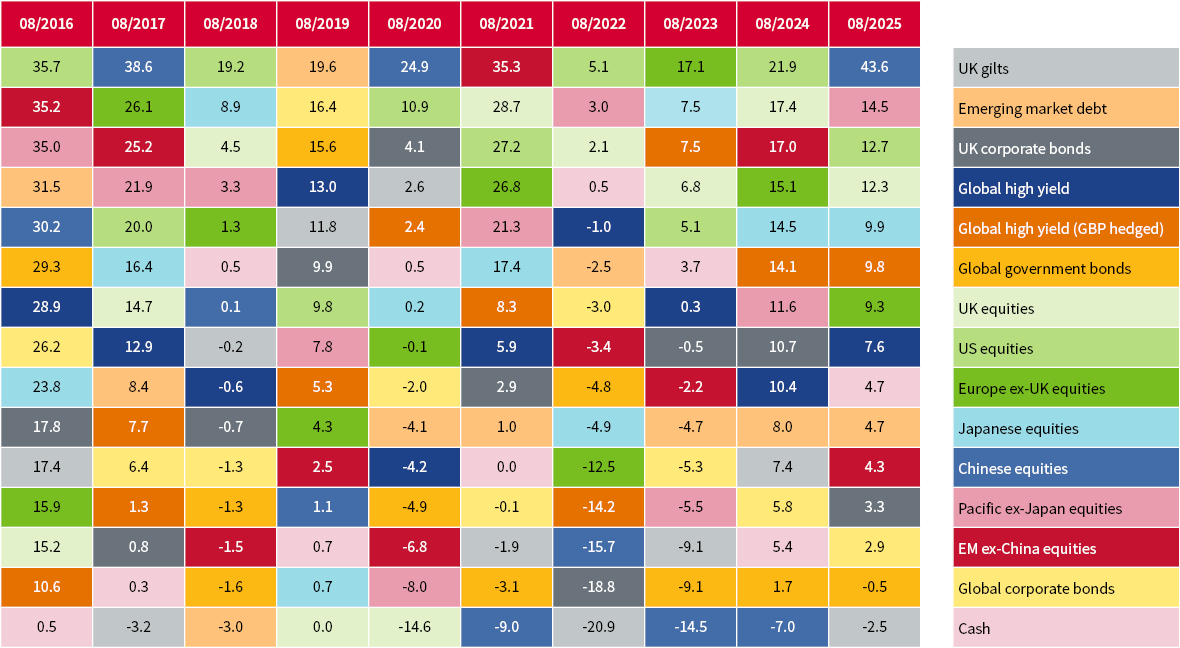
Source: Morningstar Direct, 1-year total return to end of month shown for asset classes used in the AJ Bell asset allocation.
Despite the currency impact, US equities have been consistent and often featured amongst the best performing asset classes. However, the sudden reversal of fortunes for Chinese equities has sparked greater interest amongst investors.
The rally in China this year, building on strong returns in the second half of 2024, has exposed the nuances of allocations to China. After a four-year run of poor performance and a lot of investors steering clear, it is worth reappraising what those nuances are as a case study in the importance of strategic asset allocation-related decisions, such as index selection.
When constructing an asset allocation, one of the first decisions is to find an index or category average that broadly represents the opportunity set. From the index you can then measure important data such as volatility and correlation, before ultimately using it as a benchmark for fund selection.
Any asset class has several indices available. At its most obvious, this can be the intended coverage of the index in terms of region – think pan European versus Europe ex-UK equity indices. However, the difference often lies within the index provider methodology, where free-float adjustment, inclusion criteria and country classification can have an impact on the profile of the index.
China and the wider region have important and often ignored issues here. The broadest definition of China (Greater China) includes Hong Kong and Taiwan. Over the past three years it has paid to invest in the Greater China indices, or strategies that manage around them, because they have a large allocation to TSMC in Taiwan and hence rode the dominant technology / AI theme in wider markets. If, on the other hand, you specifically targeted onshore A shares, you missed out on this trend and the 2025 AI-led rally in the offshore market too.
This is where slightly broader China indices are useful. Such indices don’t include Hong Kong and Taiwan but do target onshore and offshore shares. Onshore shares are often capped by index inclusion criteria and inclusion ratios, which are governed by a specific methodology that has been developed in the last decade.
Investors expanding their allocations into less familiar regions, or exploring new frontiers, must first navigate a steep learning curve in understanding market dynamics. Those who have spent much of the last decade understanding the intricacies of US market indices may have some catching up to do.
Here at AJ Bell, we run diversified asset allocations covering several regions, which means we are abreast of the dynamics evolving in different regions and how we can allocate to them – whether that is the A share inclusion factors of Chinese indices, or the capital gains or withholding tax implications in other regions that more directly impact how we select products to fulfil our asset allocation.
As many will know, we have spent some time deliberating how and where to allocate to China relative to the broader emerging market opportunity set, given the somewhat unique risks in that region. That resulted in a specific carve out of Chinese equities in our asset allocation for 2025 and, along with that, the decision to use broad China indices, but not the Greater China variants. Additionally, we’ve been busy assessing how to be most efficient with passive portfolios regarding the rest of emerging markets, which resulted in the use of synthetic ETFs to navigate capital gains tax in India.
Turning back to the ‘patchwork’, there are trends that have been made and broken over the decade. Gilts and government bonds had a good first five years, before inflation and higher interest rates saw them trampled for much of the second five years. Another observation is that, although sentiment and flow has been against UK equities, they have produced respectable returns in several years, in fact, in double-digits in the last two years to the end of August.
The ‘patchwork’ of annual returns continues to surprise, highlighting the challenge and importance of a diversified strategic asset allocation in a world where yesterday’s leaders may not lead tomorrow.
The value of investments can go down as well as up and your client may not get back their original investment.
Past performance is not a guide to future performance and some investments need to be held for the long term.


This area of the website is intended for financial advisers and other financial professionals only. If you are a customer of AJ Bell Investcentre, please click ‘Go to the customer area’ below.
We will remember your preference, so you should only be asked to select the appropriate website once per device.
