
Time is an investor’s best friend. Share prices can be volatile, drawing down sharply over a period of days or weeks, before (usually) recovering over a longer timeframe. However, over a period of a decade or more, history shows that an investment in a diversified portfolio of equities delivers positive returns. Indeed, one reason shares and bonds outperform cash over the long term, is the willingness of investors to accept short term uncertainty in asset valuations combined with the ability to remain a holder for the long term. This is often referred to as the ‘liquidity premium’. One of the sources of ‘alpha’ for active managers can be the harvesting of this ‘liquidity premium’ – investing in smaller or even unlisted companies where, over the long run, they can benefit from higher returns compared to investments in larger liquid companies, despite the increased risk. An argument is often made, however, that a fund is more liquid than the individual investments it holds since, although each investment may take time to liquidate, the fund manager is able to be selective of where cash is raised, taking advantage of where the buyers are in the market and making the funds units more liquid than the holdings backing them. This means investors in a fund (which in turn invests in bonds, equities and even private companies) normally expect to be able to enter and exit the fund on a daily basis for very little cost, whilst still benefiting from liquidity premiums on the underlying.
A parallel can be drawn to the Great Financial Crisis of 2008, in which the trigger was the collapse of the Mortgage Backed Security (MBS) market in the US. Put simply, investment banks repackaged low-quality mortgages together into a tradable security and, by making the assumption that diversification meant it was very unlikely that all the mortgages would suffer losses at the same time, it was deemed the MBS was of higher credit quality, in aggregate, than the individual mortgages it consisted of, when considered on a standalone basis.
We all know how that one ended!
In a similar vein, much like the experience of the MBS market in the US, the situation of funds being more liquid than their underlying holdings holds true in normal market situations, but the hypothesis fails in times of stress. The key mantra to keep in mind, therefore, when investing in any fund, passive or active, is that, in times of stress, the fund is no more liquid than the underlying investments it makes.
With the above in mind, it is always important to consider the market being tracked by a passive investment. A quick rule of thumb is to investigate the average bid/ask spreads of the securities in the index. When this is larger than average, it is an indication that the market is less liquid and the investments, therefore, carry a larger liquidity premium. The average bid ask spreads for some common indices are as follows:
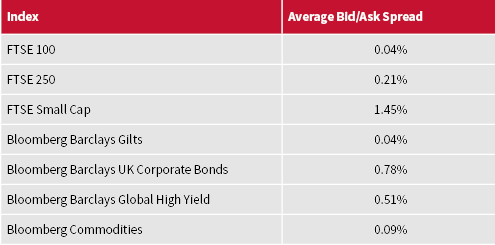
Source: Bloomberg LP, AJ Bell 15 July 2019
It is clearly not a good idea to invest in small companies passively, if you have a short time horizon. Although ETFs and index funds investing in smaller companies can be traded daily, the underlying securities are clearly less liquid and, like an active fund, the passive fund could end up either suspended (if in an open-ended fund format) or traded at a discount to underlying holding net asset value (if it is an ETF).
On the other hand, large cap equities, such as the FTSE 100 and gilts, are extremely liquid. Trading on a daily basis should not present an issue when these are the underlying investments.
Other areas such as mid cap equities (such as the FTSE 250), UK corporate bonds and High Yield Bonds should be used sensibly, with a consideration as to what proportion of your holdings are made up of these less liquid assets, since they are somewhere in the middle in terms of liquidity.
The previous examples covered well-known indices. All of them are constructed to hold higher weights in larger, liquid equities or bonds and smaller weights in less liquid securities. This is because all the equity indices are free-float, adjusted market capitalisation weighted indices. Put simply, the weighting is determined by the value of the company shares freely tradable on the exchange (excluding large holdings held by significant stakeholders). In a similar way, bond indices are constructed by considering the amount of each bond still available to trade in the market.
However, research by the Index Industry Association indicates that there are now over 70 times more stock market indices in the world than there are stocks (3.3 million at January 2018)! With a growing number of passive products tracking these indices, it is important to understand how each index is constructed, and whether the construction leads to any liquidity issues.
For example, rather than buying a product tracking the FTSE 100, you can also invest in products tracking the FTSE 100 equal-weighted index, where all holdings are held in the same proportion. This small adjustment increases the bid/ask spread by 56%. Although, in this case it is still relatively small at 0.06%, it is still an increase in liquidity risk. When navigating the myriad of indices, especially those with tilts towards small cap and value, do not take at face-value the back-tested performance showing that it outperforms the standard index (such as the FTSE 100). Instead, understand that a large part of the outperformance is due to the liquidity premium!
In what may seem an about-turn on an earlier statement, the structure of the pooled investment vehicle can and does make a difference to liquidity. It is true that in times of crisis, a fund is not more liquid than its underlying investments. However, your options as an investor during any liquidity squeeze vary depending if you have invested through an open-ended index tracker fund or an ETF.
In the unlikely scenario that a passive, open-ended fund ran into the same liquidity issues seen recently in the active space, then the same rules would apply: the fund may be suspended and investors would have to wait whilst the manager raised the required cash. This is likely to be a shorter period of time than in an active fund, as by design a passive instrument cannot hold unlisted equities.
An ETF, however, exhibits the characteristics of both an open-ended fund and a close-ended fund, and is tradable both ways. Through the Woodford issues, the close-ended investment trust Woodford runs – Woodford Patient Capital Trust – has remained tradable, albeit with the caveat that at one point the trading price was almost 40% below its fair value. Therefore an investor in the trust can make a decision between waiting for the price to recover, or accepting the haircut in exchange for immediate liquidity.
In a similar way, if an ETF ever closed its doors to subscriptions and redemptions the security can still be traded like a close-end vehicle on the stock market, or even directly with a market maker, the price received may deviate away from the fair value of the securities, but save the extreme scenario of an exchange suspending trading, the position will be sellable over a reasonable time frame.
When investing in ETFs it is therefore more important to consider how often the underlying securities within the index trade, rather than how much of the ETF has traded on the exchange. The majority of ETF trading is actually undertaken ‘over the counter’ rather than on exchange, and as such liquidity is often understated. In addition, if you want to trade a large block of the ETF, as long as a market maker can buy or sell the underlying securities (rather than the ETF), then you will be able to trade at reasonable costs. Looking at the trading volume of an ETF is, therefore, only a partial indication of its liquidity; instead a consideration should be made to the ETF size, the liquidity of the underlying securities and the bid/ask spread of the ETF itself.
As part of the Woodford issues, the liquidity of the fund was visualised, by separating the liquidity of the underlying investments into four buckets, based on the time it would take to turn the holdings into cash. We will show you the same analysis for our funds, however we have done this in two ways:
As discussed, the second measure is a better indication of liquidity, given how ETF securities are traded.
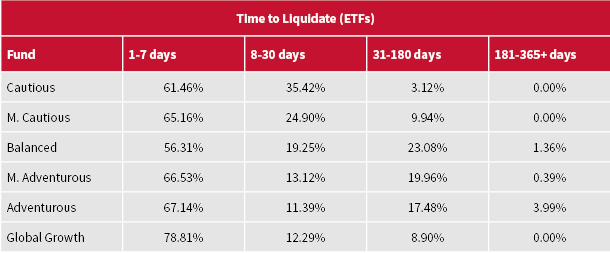
*Based on exchange traded volume of ETF, assuming 25% participation in average volume, Bloomberg LP, July 2019
It can be seen that even on this lower measure of liquidity, the majority of every portfolio can be liquidated within a week, and over three quarters within a month. As a comparison for the Woodford fund, 8% could be liquidated in a week and 37% within a month (although the methodology for this calculation may be slightly different from ours).
On the contrary, when measured on the liquidity of the underlying securities, the time taken looks like this:
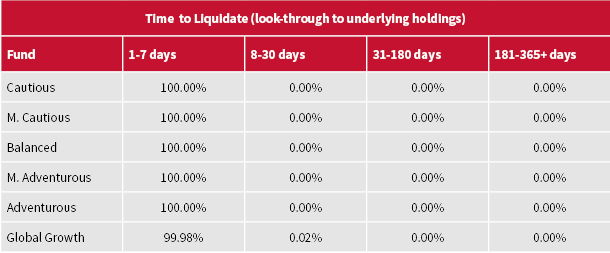
*Based on exchange traded volume of underlying securities, assuming 25% participation in average volume, Bloomberg LP, July 2019
As can be seen, based on the liquidity of the underlying liquidity of the securities within the ETFs, with the exception of 0.02% in the Global Growth Fund, all holdings could be liquidated within a week based on trading up to 25% of the daily volume of the securities – a percentage that is estimated to have minimal impact on the prices of securities.
We think it is important to match the liquidity of the products we offer to the liquidity of the securities we hold. Within our portfolio construction process we avoid investments in specific small-cap indices, and place limits on the amount we invest in areas such as high yield and mid cap securities. This means we don’t try to outperform through a tilt towards illiquid stocks and, instead, our focus remains on ensuring our asset allocation process blends together different types of assets, with different correlations (such as Technology and Consumer Staples), in order to maximise returns for a given level of risk.
When choosing which passive multi-asset range to use, ensure you understand if returns are being generated through investments in less liquid investments, such as physical property funds or ‘smart-beta’ products tilted towards smaller companies. If you want to be able to withdraw your money on a daily basis, the underlying securities should also be tradable on a daily basis, to ensure your liquidity needs are matched to that of the fund.
Finally, it is worth considering the size of the passive multi-asset range you are investing in. The larger the assets under management, the longer it would take to liquidate the security compared to a provider with lower assets. Although for large cap equities the funds would see no liquidity concerns until reaching a size way beyond the current levels, for corporate bonds capacity may become an issue at some point in the future.
For any further information, or if you would like a meeting to discuss the AJ Bell investment solutions, please contact your Business Development Team.
This area of the website is intended for financial advisers and other financial professionals only. If you are a customer of AJ Bell Investcentre, please click ‘Go to the customer area’ below.
We will remember your preference, so you should only be asked to select the appropriate website once per device.