
Gordon Gekko, the insider-trading corporate raider of 1987’s Oliver Stone film Wall Street, may have been a villain but that did not stop him talking a degree of sense. Quite what he would have made of Rivian’s $100 billion-plus market capitalisation after its first day of trading, we will never know, but we can probably guess, given his comment that “The mother of all evil is speculation.”
“Rivian’s post-IPO price tag values the company more highly than rival (and backer) Ford, even though Ford is forecast by analysts to generate more than $120 billion in sales and $6 billion in net profits. By contrast, Rivian is going to be in loss this year, not least as it only began to ship its first vehicles in September.”
Advisers and clients will not have too much time for all of the ins and outs of the Rivian investment case. But that price tag values Rivian more highly than rival (and backer) Ford, even though Ford is forecast by analysts to generate more than $120 billion in sales and $6 billion in net profits. By contrast, Rivian is going to be in loss this year, not least as it only began to ship its first vehicles in September.
Whatever advisers and clients think of Rivian’s potential, if anything, its valuation now prices in an awful lot of good news and not much bad. This is not to say anything bad will happen. But if it does, well, would-be buyers had better watch out as the valuation offers little or no downside protection.
By contrast, advisers and clients can protect their downside, and leave scope for upside, by looking at assets which may be out of favour and could therefore be undervalued as a result. The danger is that something is underperforming and cheap for a perfectly good reason, so careful research is needed. But one trend which catches this column’s eye is the 10-year underperformance of emerging equity markets relative to developed ones.
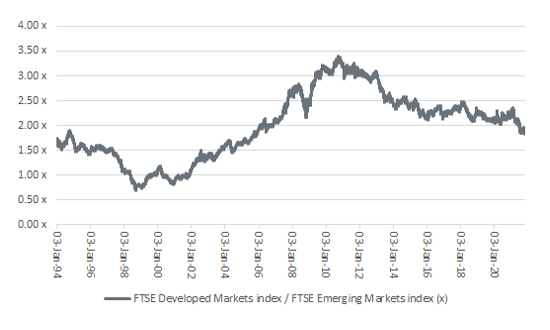
This can be seen by simply dividing the value of the FTSE Emerging by that of the FTSE Developed index. If the line rises, Emerging Markets are outperforming and if it falls, then Developed arenas are doing better.
Developed Markets have outperformed Emerging ones for over a decade
Source: Refinitiv data
“It has been one-way traffic since 2010. Developed Markets have proved to be the better portfolio pick by far and have hugely outperformed Emerging Markets.”
Developed Markets ended the 1990s on a high as the Asian and Russian currency and debt crises hammered Emerging Markets, only for them to recover just in time for the technology bubble bust to hobble the Developed ones for the best part of a decade. It has been one-way traffic since 2010, however, as Developed Markets have proved to be the better portfolio pick by far.
The questions to ask now, therefore, are ‘why?’ and ‘what could change?’.
One good guess as to the reason for the performance disparity would be the sector mix of the indices. But they are not as different as you might think. There is a similar representation in technology and the percentage weighting toward cyclical sectors such as financials, industrials and consumer discretionary. Emerging Markets’ greater weighting toward financials in a margin-crushing, zero-interest-rate environment may not help, and nor may the higher weighting toward energy and basic materials (mining) during a low-growth, low-inflation decade, but neither looks conclusive.
“Note that the runaway US equity market represents two thirds of Developed Market capitalisation and China more than one third of that of Emerging Markets.”
A more convincing explanation comes in the form of geographic exposures. The runaway US equity market represents two thirds of Developed Market capitalisation and China more than one third of that of Emerging Markets.
Sector weightings may not explain Emerging Markets’ underperformance…
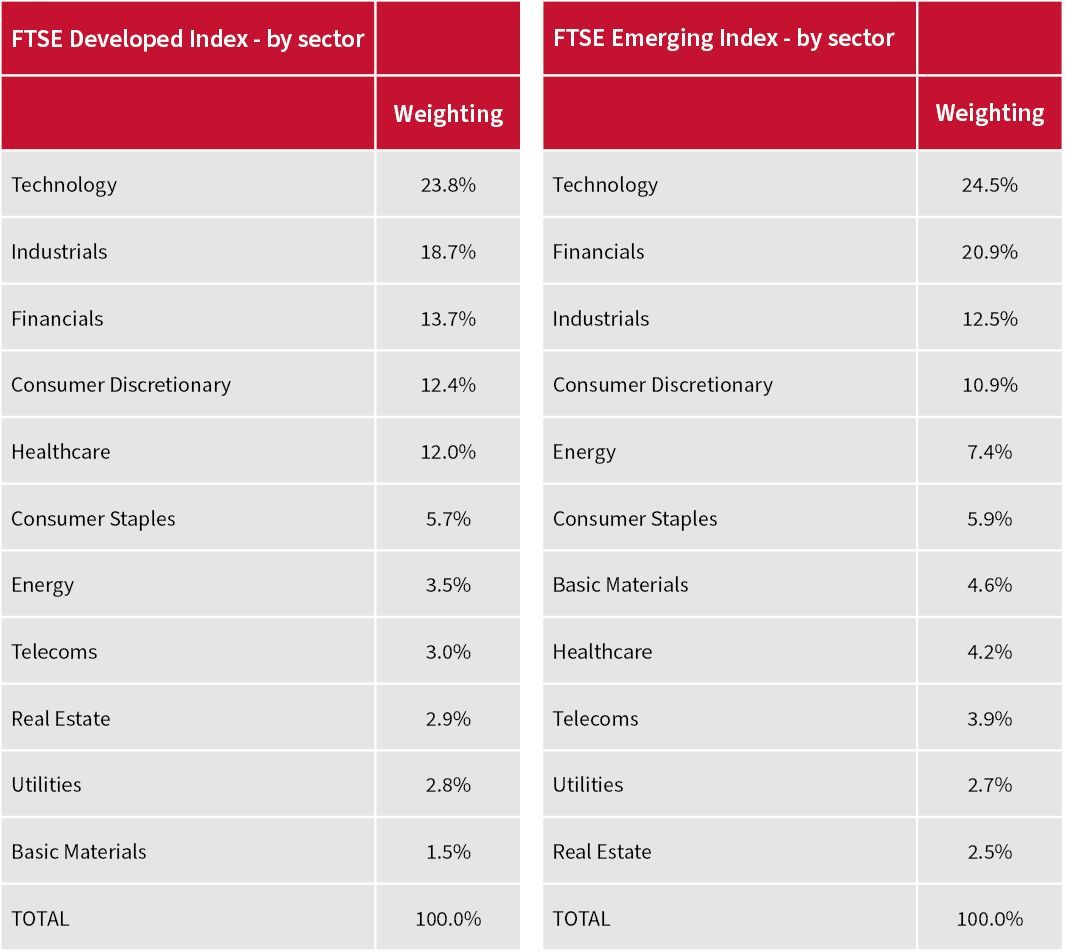
Source: FTSE Russell as of 29 October 2021
… But geographic ones may underpin Developed Markets’ dominance
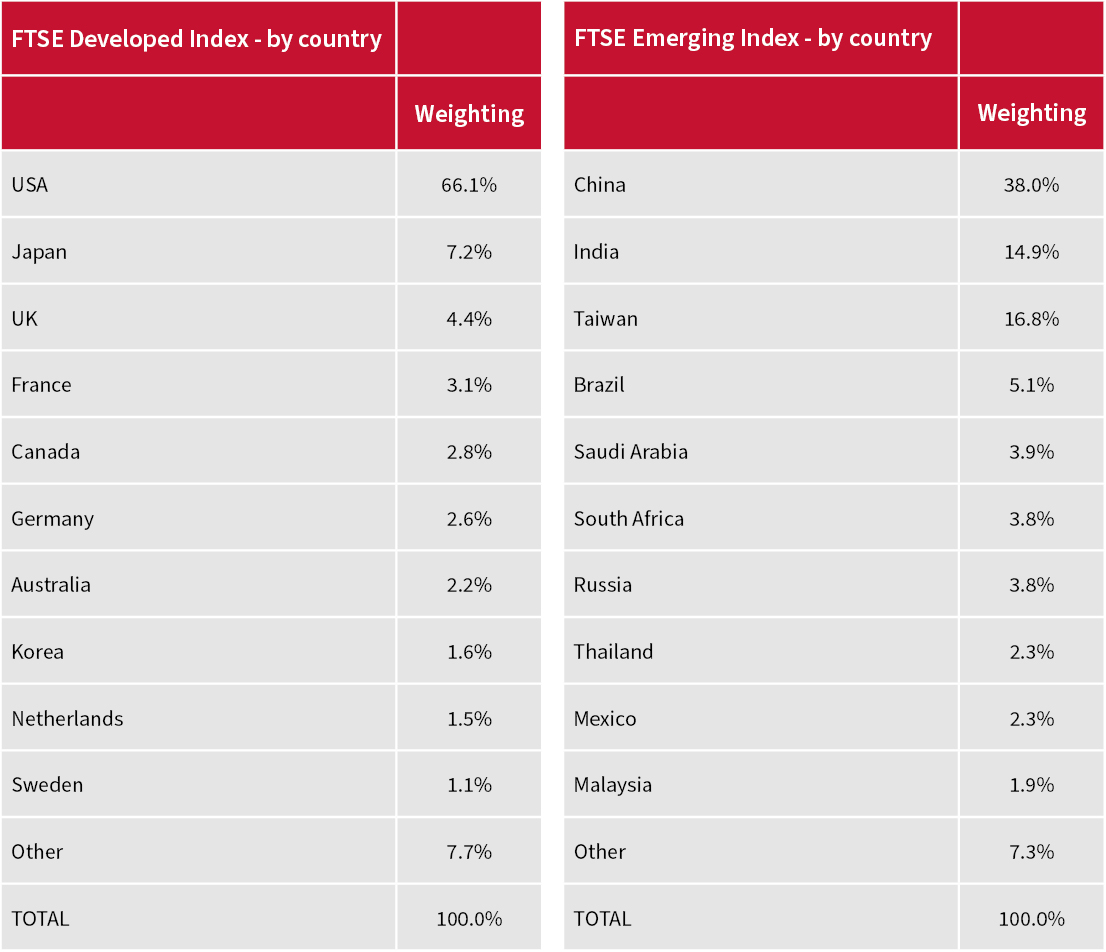
Source: FTSE Russell as of 29 October 2021
This is not the only reason – China’s weightings have increased over time as overseas listings and the domestically-traded stocks have entered global indices – but the S&P 500 is up by more than 300% since January 2010 and the Shanghai Composite by just 7%, so it could well be a factor.
US stocks have massively outperformed Chinese ones since 2010
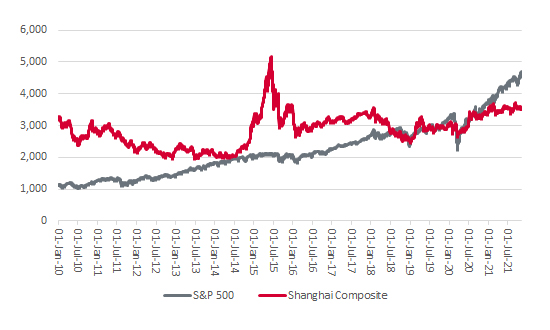
Source: Refinitiv data
After a long and loud clamour for their inclusion, index compilers are now busily excluding Chinese stocks owing to US sanctions, governance issues and more besides. That may appeal to contrarians, who will also baulk at the valuation attributed to US stocks. The Case-Shiller cyclically-adjusted price earnings (CAPE) ratio is no use at all as a near-term timing tool and history is by no means guaranteed to repeat itself. But the 2 previous occasions when the CAPE exceeded 30 times, and the 4 prior times when we saw 10-year historic compound returns from the S&P 500, have all seen the next decade’s returns from US equities tail off very badly indeed.
“The 2 previous occasions when the CAPE exceeded 30 times, and the 4 prior times when we saw 10-year historic compound returns from the S&P 500, have all seen the next decade’s returns from US equities tail off very badly indeed.”
US have historically provided poor long-term future returns once the Shiller CAPE exceeds 30
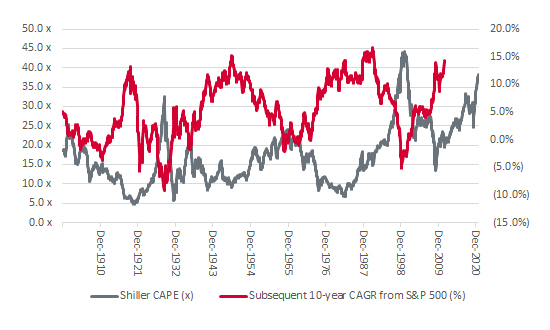
Source: econ.yale.edu/~shiller/data.htm
Some advisers and clients will be happy to stick to the maxim that “the trend is your friend” and row in with the US and Developed Markets over China and their Emerging counterparts. Others will keep the combination of Gekko and Shiller’s CAPE in mind.
“Granted, China is trying to support its economy while managing a huge debt mountain and trying to stop financial speculation from derailing its economy through poor capital allocation. But you can argue the US faces the same challenge, even if it comes with far superior corporate governance and investor protection.”
Granted, China is trying to support its economy while managing a huge debt mountain and trying to stop financial speculation from derailing its economy through poor capital allocation. But you can argue the US faces the same challenge, even if it comes with far superior corporate governance and investor protection.
China is acting and could be running monetary policy that is too tight as a result. That leaves it room to loosen. The Federal Reserve might just be ducking the challenge and running policy that is too loose. As a result it may have to tighten at some stage whether it likes it or not, in a reversal of policy that could, one day, break a 10-year-plus trend in American relative share price performance.
Past performance is not a guide to future performance and some investments need to be held for the long term.


This area of the website is intended for financial advisers and other financial professionals only. If you are a customer of AJ Bell Investcentre, please click ‘Go to the customer area’ below.
We will remember your preference, so you should only be asked to select the appropriate website once per device.
