At first glance, US stocks look fully valued, based on traditional valuation metrics like the PE (price to earnings) ratio, but a new study by researchers at the Federal Reserve of Minneapolis suggests equity markets may be less expensive than generally thought.
If the new research holds water, it could have big implications for stock markets and future investment returns.
Looking through the lens of traditional valuation metrics like economist Robert Shiller’s CAPE (cyclically adjusted price to earnings) ratio, the US market is sitting on a ratio of 40 times, close to its highest ever mark of 44 times, hit in December 1999, during the dotcom era.
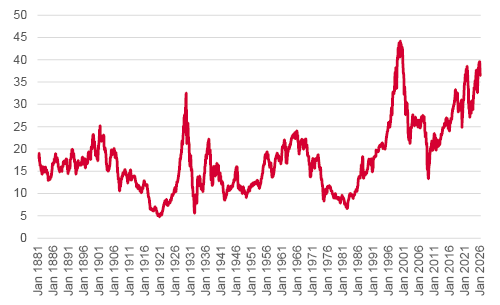
Source: Robert J. Shiller
The CAPE differs from the PE ratio in that it uses 10-year average inflation-adjusted earnings, instead of last year’s or next year’s expected earnings.
Dividends are another popular way to look at valuation, although the increased use of share buybacks in recent years may have reduced their usefulness.
Nevertheless, the message is the same as seen from the PE ratio, with the dividend yield of the S&P 500 sitting at 1.1% – matching the lowest-ever yield achieved in August 2000.
Shiller has also created a measure called the Excess CAPE yield, which subtracts the 10-year bond yield from the earnings yield, calculated by taking the inverse of the PE ratio.
As Shiller points out, this measure of value has offered a great guide to how equities have fared over the ensuing decade. The current reading of around 1% implies US stocks are priced to deliver a miniscule 1% average annual return over the next 10 years.
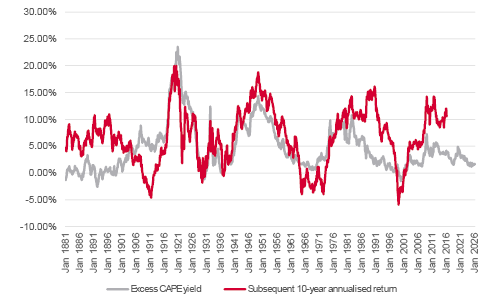
Source: Robert J. Shiller
For context, US stocks have delivered close to 15% average annual returns over the past decade, which was only eclipsed in the 1950s when the market delivered close to 20% annual returns.
Critics point out the Shiller PE is too backward looking. It can be argued that, because businesses change, earnings from 10 years ago have little relevance to investors today. The stock market is forward looking, trying to figure out what might happen in the next decade.
One way to address this perceived drawback is to use the forward PE, which is based on consensus analysts’ earnings estimates for the next 12 months.
From a low of under 8 times in 2008, the forward PE has more than doubled to sit close to around 22 times – just under the all-time peak of a little over 24 times, which was reached in January 2000.
Unlike the CAPE, which dates to 1871, data for the forward PE only goes back to 1985. Although it varies to an extent, it still largely gives the same ‘stretched’ valuations message as the CAPE and dividend yield.
Researchers from the Minneapolis Fed used macroeconomic data sourced from the IMA (Integrated Macroeconomic Accounts). This is a big undertaking, involving crunching data collected by the BEA (Bureau of Economic Analysis) and the FRB (Federal Reserve Board) from households, businesses and government.
The authors note this is a more detailed historical record of the economic factors which drive changes in free cash flow to shareholders. Annual free cash flow is the money generated by a business after deducting all operating costs, interest payments and investments to maintain or grow the business. Free cash flow can be ‘lumpier’ than reported earnings, which are designed to smooth expenditures like investments.
Enterprise value is the market value adjusted for debt and other liabilities. It represents the total value a buyer of a company would need to pay.
The researchers show there is little difference between the two methodologies when looking at earnings-based metrics, but using their version of free cash yield paints a less extreme picture of market overvaluation. The current free cash flow yield, while at the lower end of the spectrum, is about the same level as it was in 1982.
One standard deviation is a statistical measure of how far something is from its average. The reading in late 2022 was just shy of one standard deviation below the average, which means it was within the realms of what might be expected during the normal ebb and flow in data due to the economic cycle.
The research paper suggests the different results stem from a greater proportion of free cash flow ending up in shareholders’ pockets than implied by earnings measures.
For example, free cash flow increased from 4% of total cash generated in 1980 to 12% in 2022. The researchers suggest this is down to a combination of a smaller amount of cash being paid to employees, and companies forking out less in capital expenditures. In other words, employees have taken a smaller share of the economic pie, and the pie has been able to expand with a lower investment since 1982.
This could be explained by a rise in intangible assets relative to tangible or physical assets, a feature of the corporate landscape over the past few decades. Tangible assets include buildings, factories and machinery. Intangibles are things you cannot touch, like brand names, client relationships, patents, installed databases and distribution networks. Intangibles are difficult to place a value on, and hard to replicate from a competitive standpoint.
The authors of the paper suggest one other intriguing explanation for lower investment spending, namely a big increase in monopoly power in recent decades. This points the finger at big technology companies which have enjoyed a period of unencumbered strong growth and influence.
The Magnificent Seven (Apple, Alphabet, Amazon, Meta, Microsoft, NVIDIA, and Tesla) have seen their collective market value in the S&P 500 index more than double, from 16% in 2016 to around a third – a record concentration level.
One feature driving the rise of these companies has been their strong free cash flow, due to ‘asset light’ business models. This has changed dramatically since the arrival of AI, with their combined capital expenditures projected to exceed $700 billion in 2026.
Since the Fed paper data is limited to late 2022, we do not yet know how the picture could have changed due to the acceleration in AI investments seen over the last two years.
That said, given the technology firms represent such a significant proportion of the total free cash flow in the S&P 500, it seems reasonable to assume the free cash flow yield has dropped further since 2022.
Historically, these firms have spent 12% to 15% of revenues on capital expenditures. In 2026 capital intensity is expected to hit 33% to 45% of revenues – some of the highest rates since the dotcom era in the late 1990s. This will likely squeeze their combined free cash flow.
Past performance is not a guide to future performance and some investments need to be held for the long term.



This area of the website is intended for financial advisers and other financial professionals only. If you are a customer of AJ Bell Investcentre, please click ‘Go to the customer area’ below.
We will remember your preference, so you should only be asked to select the appropriate website once per device.