
A simpler methodology for the creation of portfolios has been introduced, that splits long-term asset allocation calls from AJ Bell’s market views. The purpose is to create portfolios that behave in a predictable manner at a strategic level, whilst allowing for an additional layer of risk management where portfolios can be adjusted to offset perceived risks.
The process of using a mean variance optimisation for the initial portfolio asset allocation creation is unchanged, however using a narrow set of large asset classes. There is a level 1 allocation that considers asset type (equity, bond and alternative) and currency risk (sterling and non-sterling) and level 2 implementation breaks down these asset types to smaller asset classes that consider factors such as geography and credit risk.
A level 3 set of assets has now been introduced, which are a further delineation of level 2 asset classes that are used to build greater flexibility for offsetting risk in disparate portfolios.
The previous year saw a sharp increase in fixed income yields. This has led to a compression of the premium received for taking additional risk. Consequently, the projected return expectation of bonds is greatly improved both in absolute terms as well as compared to other asset classes.
Credit spreads have widened with the largest moves in the higher-risk areas as inflation and fears of a global slowdown became prevalent.
Equity market return expectations improved modestly through the year. However, the improvement in outlook was less pronounced than in bond markets. Additionally, the spread between the best return expectations and worst return expectations narrowed considerably, which removed some of the return premium in some parts of the equity market.
A sharp fall in property valuations because of rising interest rates has raised the long-term return expectations in the class to much more competitive levels commensurate with the risk.
In line with generally higher return expectations in nearly all asset classes, the return expectations for portfolios across the risk spectrum has improved. Because the increase in return expectations was starkest in the fixed income market, there has been a greater shift higher in lower risk portfolios. This has flattened the efficient frontier somewhat and therefore the return premium for additional levels of risk has condensed.
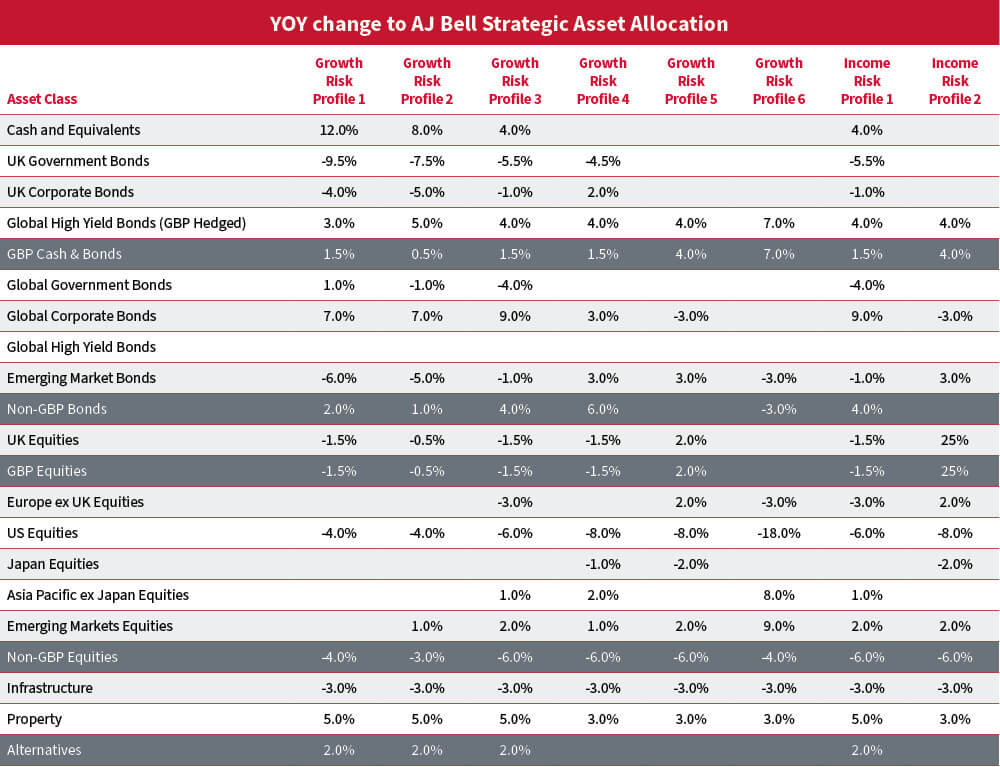
All portfolios have seen a rise in fixed income allocation at the expense of a smaller equity allocation. With the removal of maturity as a strategic consideration in portfolio construction, there has been a natural increase in the duration profile of the fixed income portion of the portfolios. However, by taking inflation linked bonds as a subset of bonds rather than considering it a strategic asset, there is a lower duration compared to the benchmark. In other words, duration has increased but remains lower than most.
There has been an increase in allocation to high yield debt in line with the asset class seeing the largest increases in long-term return expectations amongst all asset classes.
The lower risk portfolios have larger exposure to cash and cash equivalent assets such as money market funds. This was driven by a sharp increase in the yield on cash during the year because of rises in interest rates.
Within equities, the removal of sectors as a strategic asset, which were implemented through US proxies, is partly responsible for a decline in US equity exposure. This exposure has been largely allocated towards Emerging Market equities and Asia Pacific ex Japan where the return expectations have improved over and above that of the general equity market.
In line with the improved outlook in property, there has been a switch in the alternatives sector from infrastructure towards UK property.
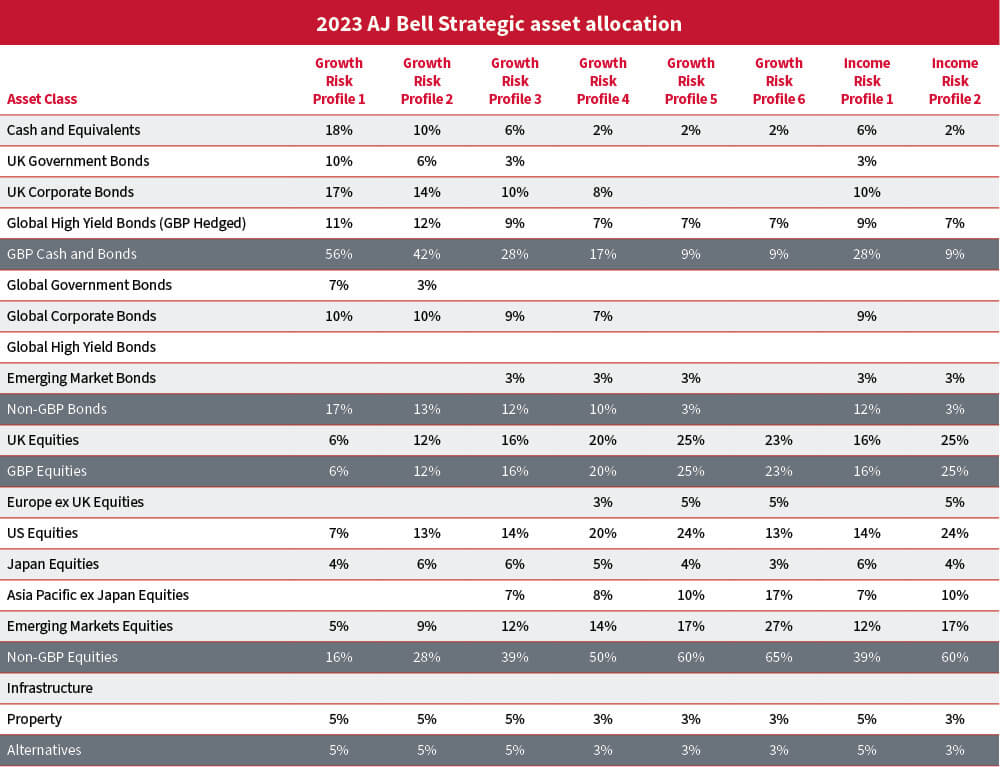
Note: there has been a considerable reduction in the number of assets considered at strategic level; with their effective changes grouped into the new level 2 asset to which they belong. This accounts for much of the 18% reduction in US equities in risk profile 6 because of the removal of sectors.
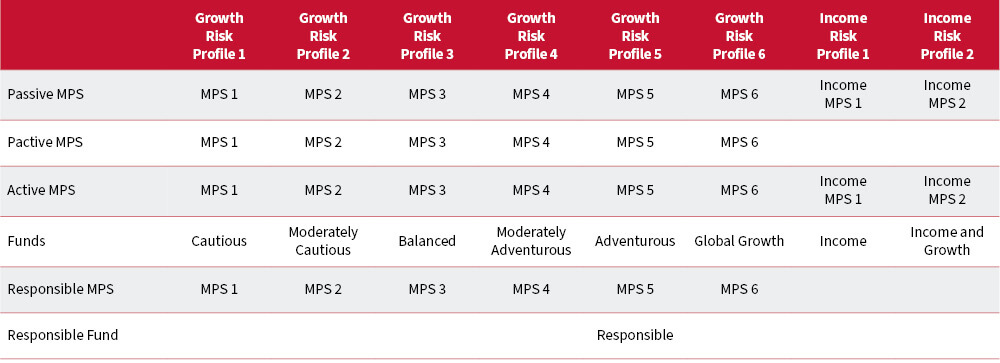
The latest MPS and Funds portfolio grids are available to download below:
This report provides general information about the AJ Bell Funds. It should not be read or construed as investment advice. It is your responsibility to assess your circumstances and make sure it is suitable for your needs.
The value of investments can go down as well as up and you may not get back your original investment.
Past performance is not a guide to future performance and some investments need to be held for the long term.
The target yields are not guaranteed and can fluctuate.
This area of the website is intended for financial advisers and other financial professionals only. If you are a customer of AJ Bell Investcentre, please click ‘Go to the customer area’ below.
We will remember your preference, so you should only be asked to select the appropriate website once per device.