
First published in 2002, S&P have been producing what it calls the SPIVA (S&P Index Versus Active) scorecard for nearly two decades. It is a quantitative review of how active managers have performed across various time periods against a relevant S&P benchmark.
The most recent numbers for sterling-denominated funds were released by S&P in March 2022, for the calendar year ending 2021.
The headline statistics show that very few active managers outperform the benchmark when measured over long time periods, with more variable results over shorter time periods, or for more niche asset classes.
We have selected a sample of performance statistics from the report:
Like any statistics produced in a report, these can be used by the user to confirm their view – for a rules-based investor it confirms their belief that markets are efficient, and it is hard for an active manager to add value consistently. On the other hand, for those in the active management camp, it shows that although picking the winning managers may be hard, good managers do exist, especially in less certain markets such as UK small cap and emerging markets.
However rather than travelling down the well-trodden debate of active vs passive performance, the statistic that popped out to me was not how many funds have outperformed, but merely how many funds have just survived.
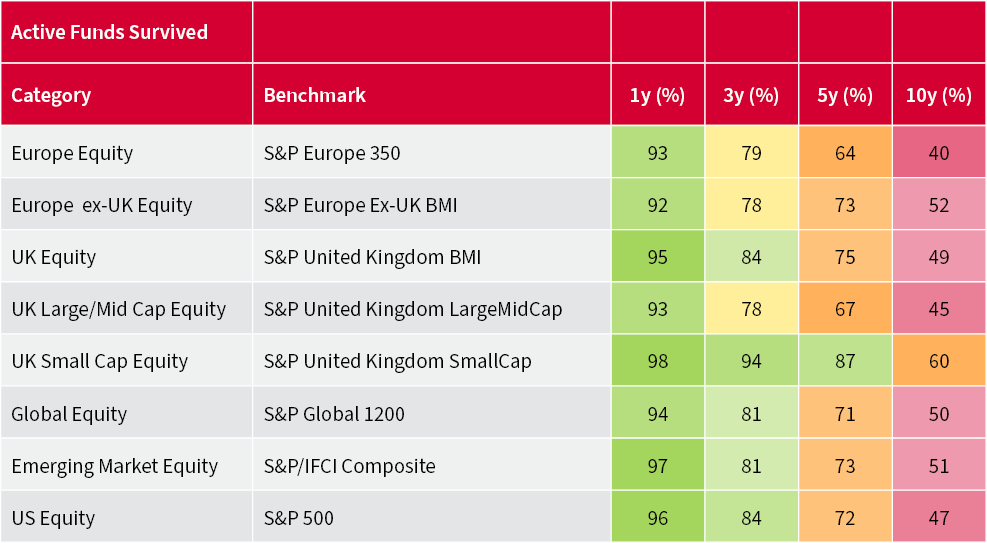
Source: S&P, Morningstar, December 2021
Of the funds in existence on 1 January 2012, only one in two of them are still going. This is staggering, given most funds tell investors they should invest in them for at least five years. Not all funds will have disappeared altogether, with several of them merging into other funds, however as an investor in an active fund, the question perhaps shouldn’t be ‘will this fund beat the benchmark’, but rather ‘will it still exist in the long term?’.
S&P use the Morningstar categories to determine the relevant sector for each fund; these are as follows:
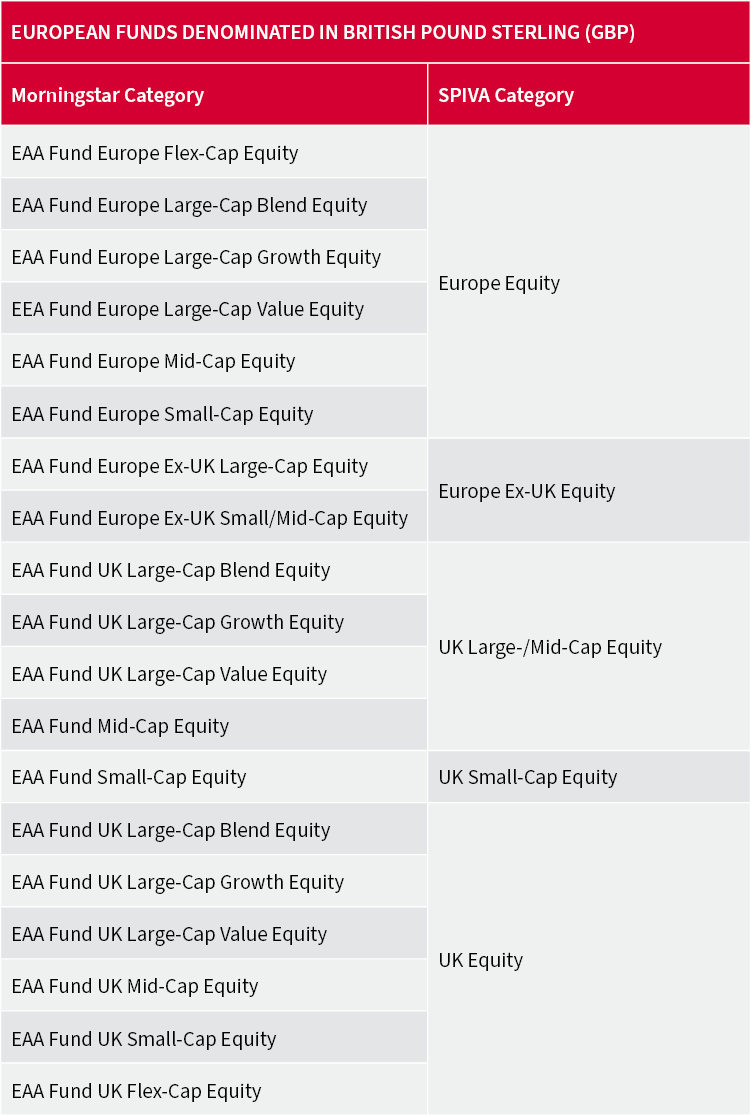
Source: S&P, Morningstar, December 2021
We have rebuilt these sectors ourselves to drive further analysis of the funds that have survived.
Based on the criteria of sterling-denominated, open-ended active funds within these sectors, 640 funds have a 10-year performance track record. These funds are managed by 129 different managers. However just 21 of the 129 managers operate 330 out of the 640 funds, representing over half of the surviving funds.
A list of the managers with 10 or more funds with a 10-year track record is as follows:
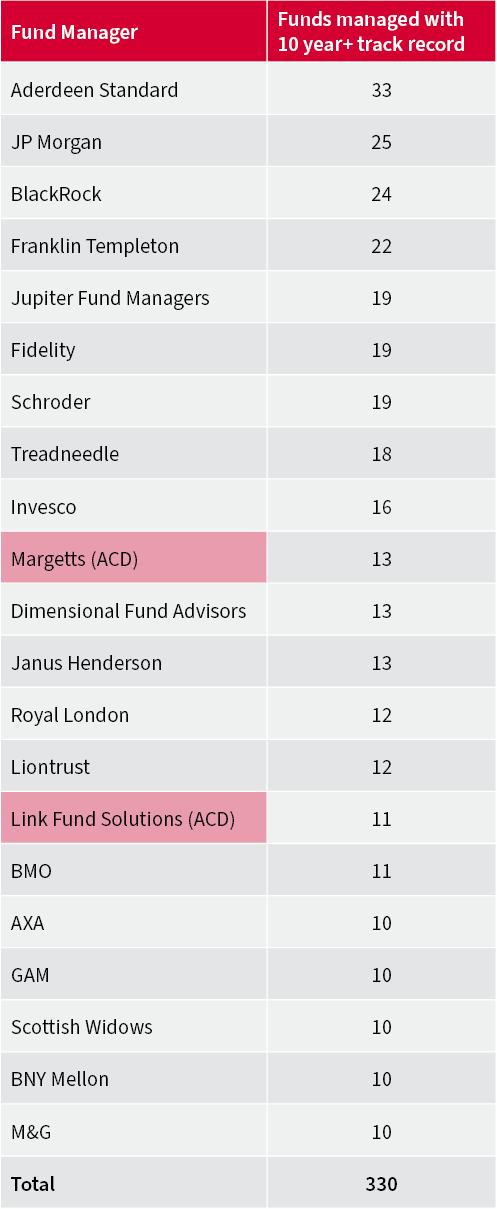
Source: Morningstar, AJ Bell, December 2021
We have highlighted in red two independent ACDs (authorised corporate directors) that operate funds for several different managers. Outside these two, most people in the investment industry will have heard of almost all the other managers.
To me, this points to the conclusion that for an active manager to be successful over the long term, having available the resources of a large asset manager is imperative to ensure that the process they put into place is both robust and repeatable.
Within the AJ Bell MPS, where active managers are used, for the main we do use funds from household names. Although this might not be as glamourous as picking the boutique manager no-one else has heard of, for us it is important to focus on the long-term performance outcomes of the portfolios, where survival is more important than performance, as disruption to the fund, such as mergers and closures, could affect customer outcomes negatively.
At AJ Bell we are always focused on ensuring investments represent good value for money, and we only use active mangers where we believe there is a fair chance they will be able to beat the benchmark on a long-term view. The SPIVA scorecard provides a good starting point to understand in which areas of the portfolios we will use active managers, and where we believe implementing passively is more cost effective. However, diving deeper into the underlying data delivers further insights, with the results counterintuitive at first.
Of the 640 funds with a 10-year track record, the average assets under management for each fund was £725 million when each fund last reported data. On the other hand, 1,056 funds are in the Morningstar sectors with less than 10 years’ performance corresponding to the SPIVA categories. It is no surprise that the average asset size of these funds is significantly smaller at £510 million, or to put it another way, 30% lower.
What is perhaps surprising, given the regulator’s drive to ensure benefits of scale are passed on to investors, is that the average ongoing cost of funds with a 10-year track record is almost 50% higher than the group with less than a 10-year track record, sitting at 1.38%, compared to 0.93% for the newer funds. The following graph shows the trend between the age of a fund and the fees it charges.
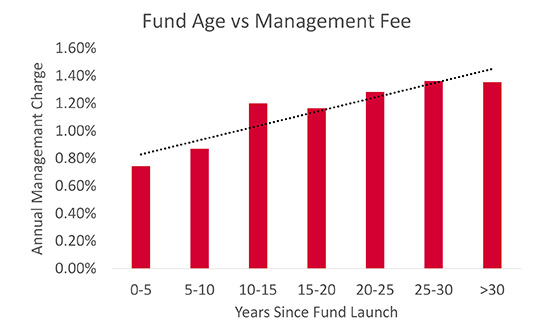
Source: Morningstar, AJ Bell, March 2022
This shows that despite being larger in size, a fund with a long, successful track record can charge a premium for its management, despite the fact they are operating larger funds on average. Newer funds need to offer lower costs to be competitive against incumbents, and to compete against passive funds.
This creates a conflict when building our portfolios. On one hand we aim to keep costs reasonable, but on the other hand sometimes we are forced to pay up for a successful fund with a good track record. Therefore, as part of our research process we do not set any strict fee budgets, however price is one of the five factors considered. This perhaps points to why there hasn’t been as much of a squeeze on active fund management fees as many expected, with a strong performance record demanding a premium.
Past performance is not a guide to future performance and some investments need to be held for the long term
This area of the website is intended for financial advisers and other financial professionals only. If you are a customer of AJ Bell Investcentre, please click ‘Go to the customer area’ below.
We will remember your preference, so you should only be asked to select the appropriate website once per device.